Wild Thang: Embroidery Production Digital Twin
A live digital twin of an embroidery production line, built around a fleet of HCR3 embroidery machines: real-time machine data, NFC-tagged operator tracking, an integrated AI assistant for querying the factory floor in natural language, and research into computer-vision tracking as a further data source.
Context and funding
Wild Thang is a Liverpool garment-decoration company, and this work was carried out with them during my internship at the Virtual Engineering Centre (VEC), University of Liverpool, in two funded parts. Part one, digitalising production (the dashboard, the machine data pipeline, and job tracking), was funded by Horizon Europe. Part two, research and innovation, was funded through LCR Innovations by the Liverpool City Region Combined Authority; it covers the CCTV tracking research below, and the benchmarking and simulation work described in Agentic Factory, which uses Wild Thang's factory floor as its first use case.


What it covers
Each HCR3 machine logs its own production data as it runs (stitch counts, per-job run reports, thread breaks, errors); a backend pipeline pulls that off the machines and into MongoDB, structured by job, design, and operator rather than left as raw per-shift exports. Operator identity and shift attendance come from a separate NFC pipeline: a phone or badge tap against an NFC tag logs which employee is working which machine, read by a Raspberry Pi at each station, queued locally if the network drops and flushed to the database once it's back, so a temporary connectivity loss doesn't lose data.
Sitting on top of both data sources is an AI assistant built into the dashboard itself, answering natural-language questions about the factory floor. A separate, earlier-stage research track looks at multi-camera multi-target (MCMT) tracking, using camera-based tracking datasets and literature to work out whether computer vision could add a further, independent layer of floor-activity data alongside the machine logs and NFC taps.
What the dashboard shows
The problem at the start was that production decisions were not backed by data, so time lost to stalled machines, thread breaks, and slow designs went unnoticed. The dashboard is read-only: it never controls the machines, and its job is to make that data readable for operators and supervisors.
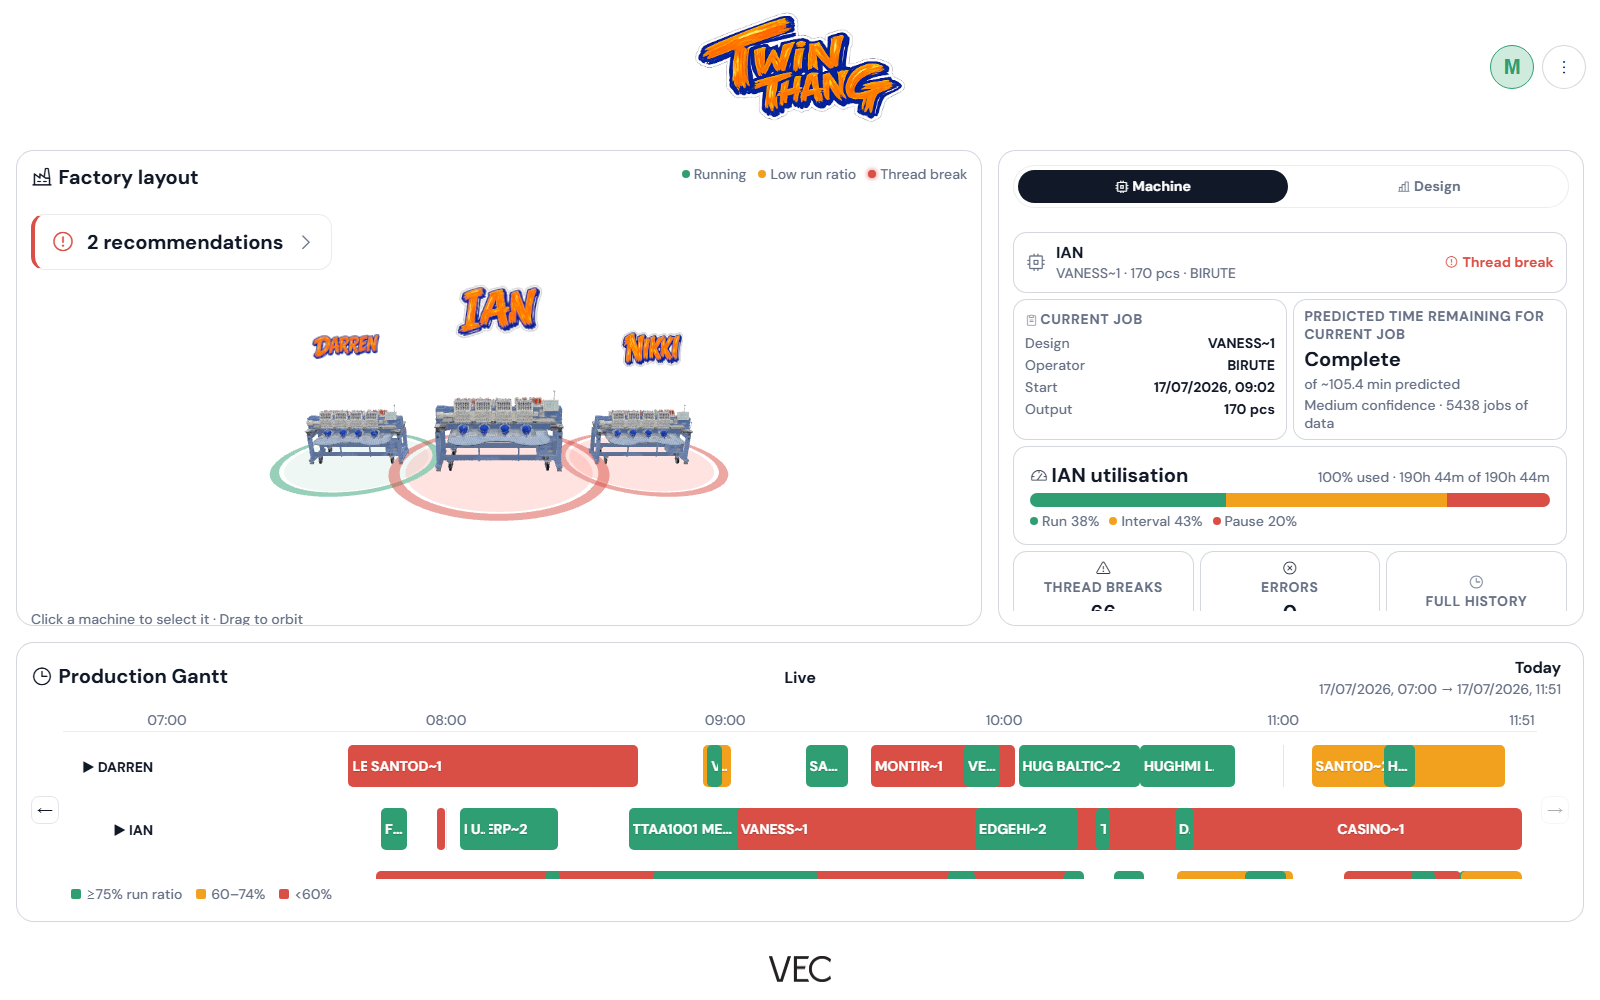
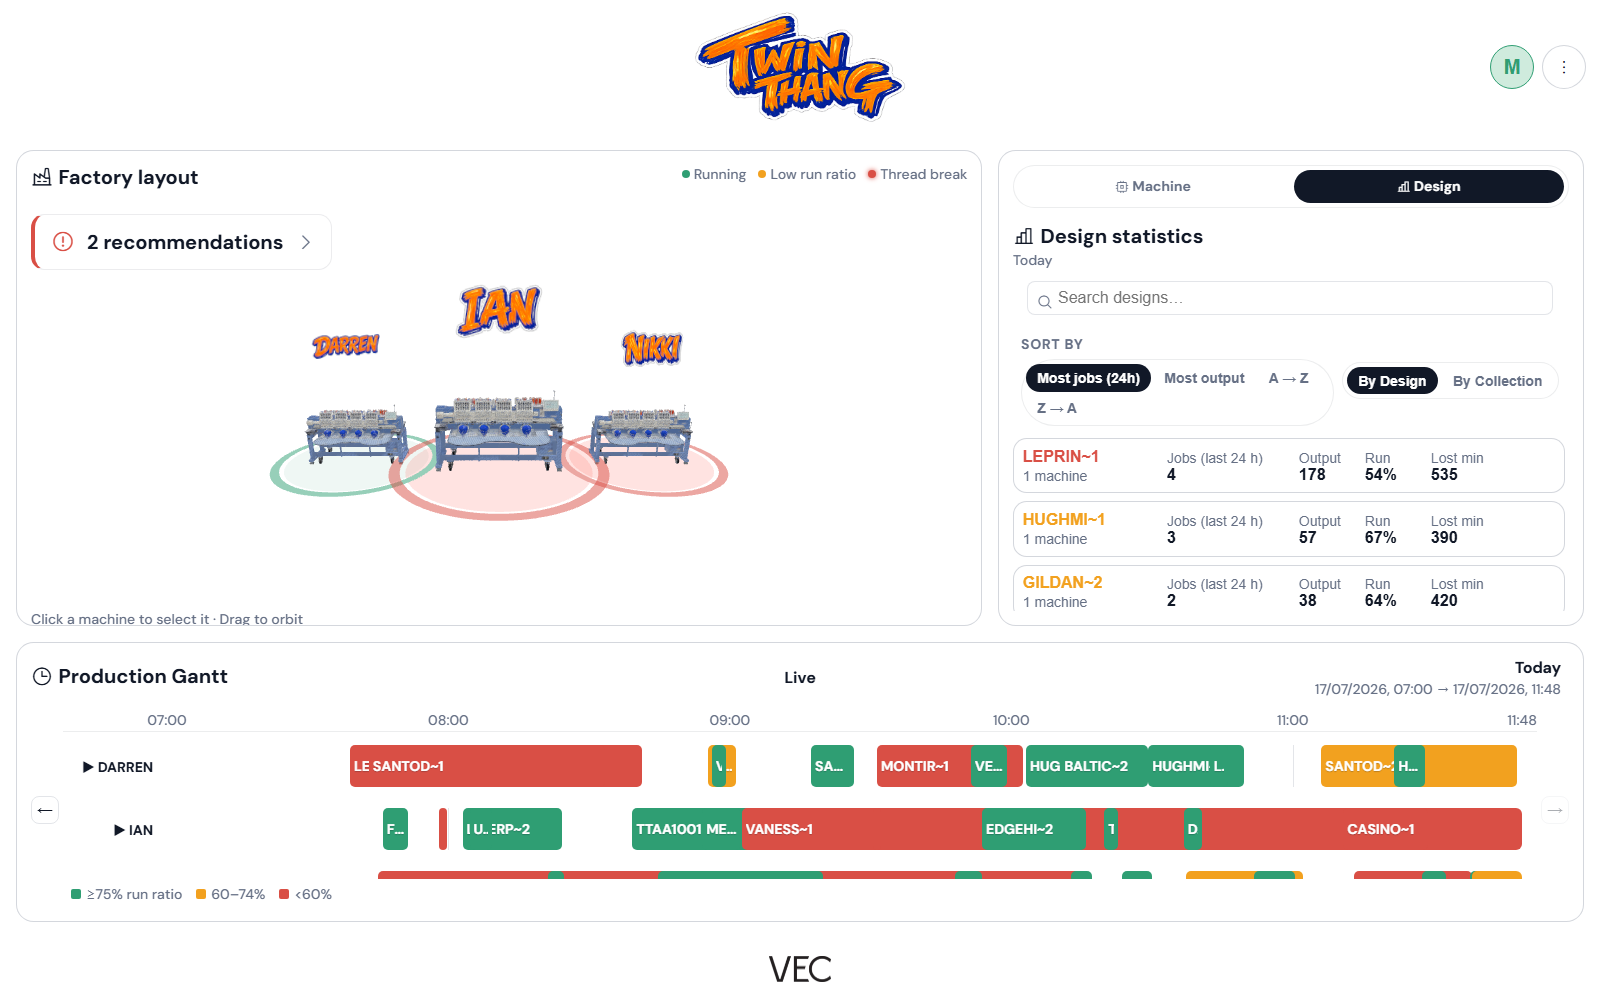
- 3D factory view. Each machine is a labelled 3D model with a coloured ring for its status: running, idle, low run ratio, or thread break.
- KPI cards. Jobs running now, output per hour and per day, and a run-ratio gauge. Each card opens a chart or table with comparison against the factory average or the previous period.
- Alerts and recommendations. A banner surfaces automatic suggestions in three tiers (urgent, useful, optional), triggered by rules on thread breaks and idle time, such as a machine standing idle for 30 minutes or more during working hours.
- Predicted time remaining. An estimate for the current job based on past jobs with the same design on the same machine, scaled by progress so far and the current run ratio, shown with a confidence label and the number of historical jobs behind it.
- Design tab. Designs grouped into collections and ranked by jobs, output, or lost time, with the job history for each, which shows whether a design is slow or prone to thread breaks across machines.
- Weekly summary export. A print-ready seven-day report (KPIs, machine breakdown, daily output, top designs, thread breaks, and recommendations) designed for production meetings.
- A glossary. The user guide separates fields the HCR3 reports directly (run time, pause time, output) from values the dashboard derives (run ratio, total stitches, design collections), so any figure can be traced back to how it was produced.
A legacy version of the assistant was an OpenAI-powered chatbot that could produce charts and used retrieval over the machine manuals to answer operating questions alongside production advice. The current assistant, described below, uses a stricter pipeline.
Closing the data gap: no API, no problem
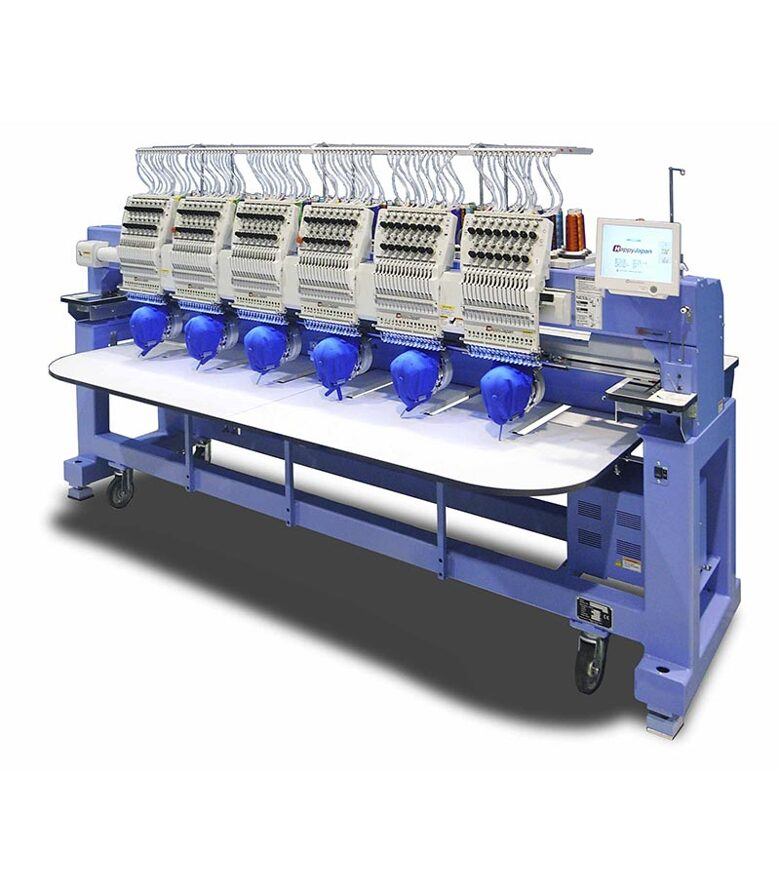
The HCR3 machines themselves expose no API at all: the only way to get a job's stitch counts, run ratio, and thread-break history off a machine is to stand at its touchscreen, navigate to the report view, and copy the log to a USB stick by hand.
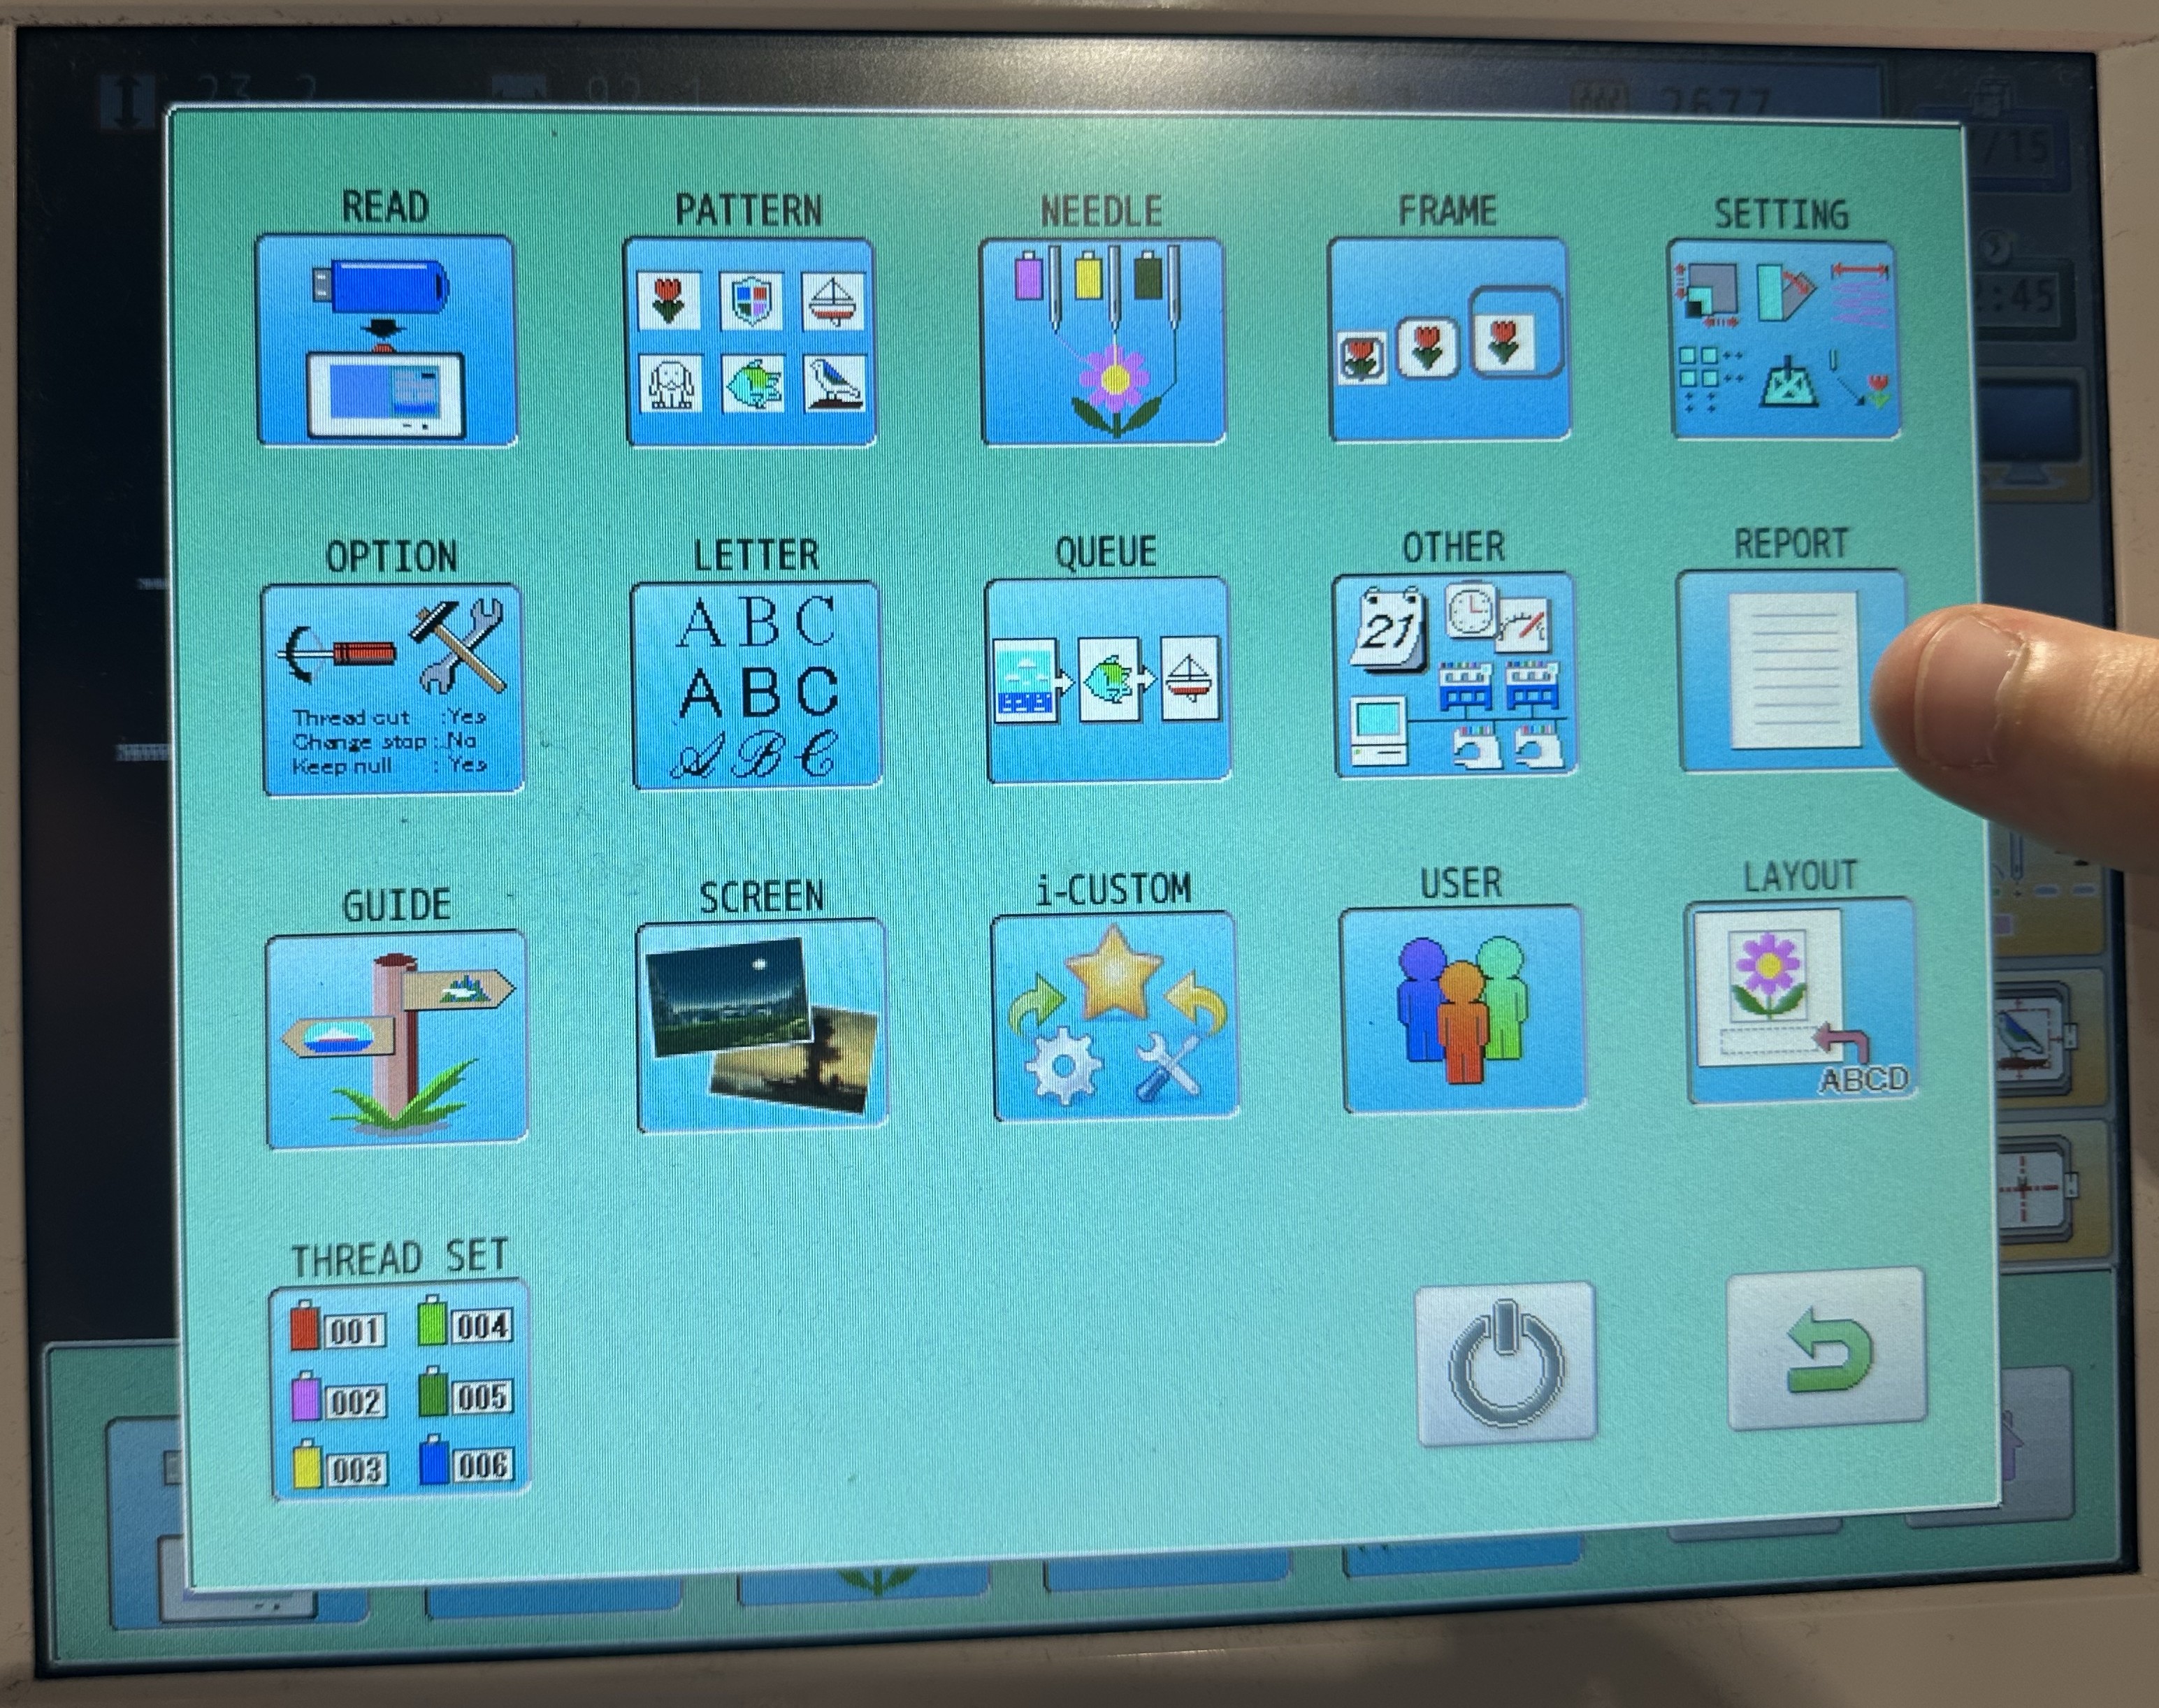
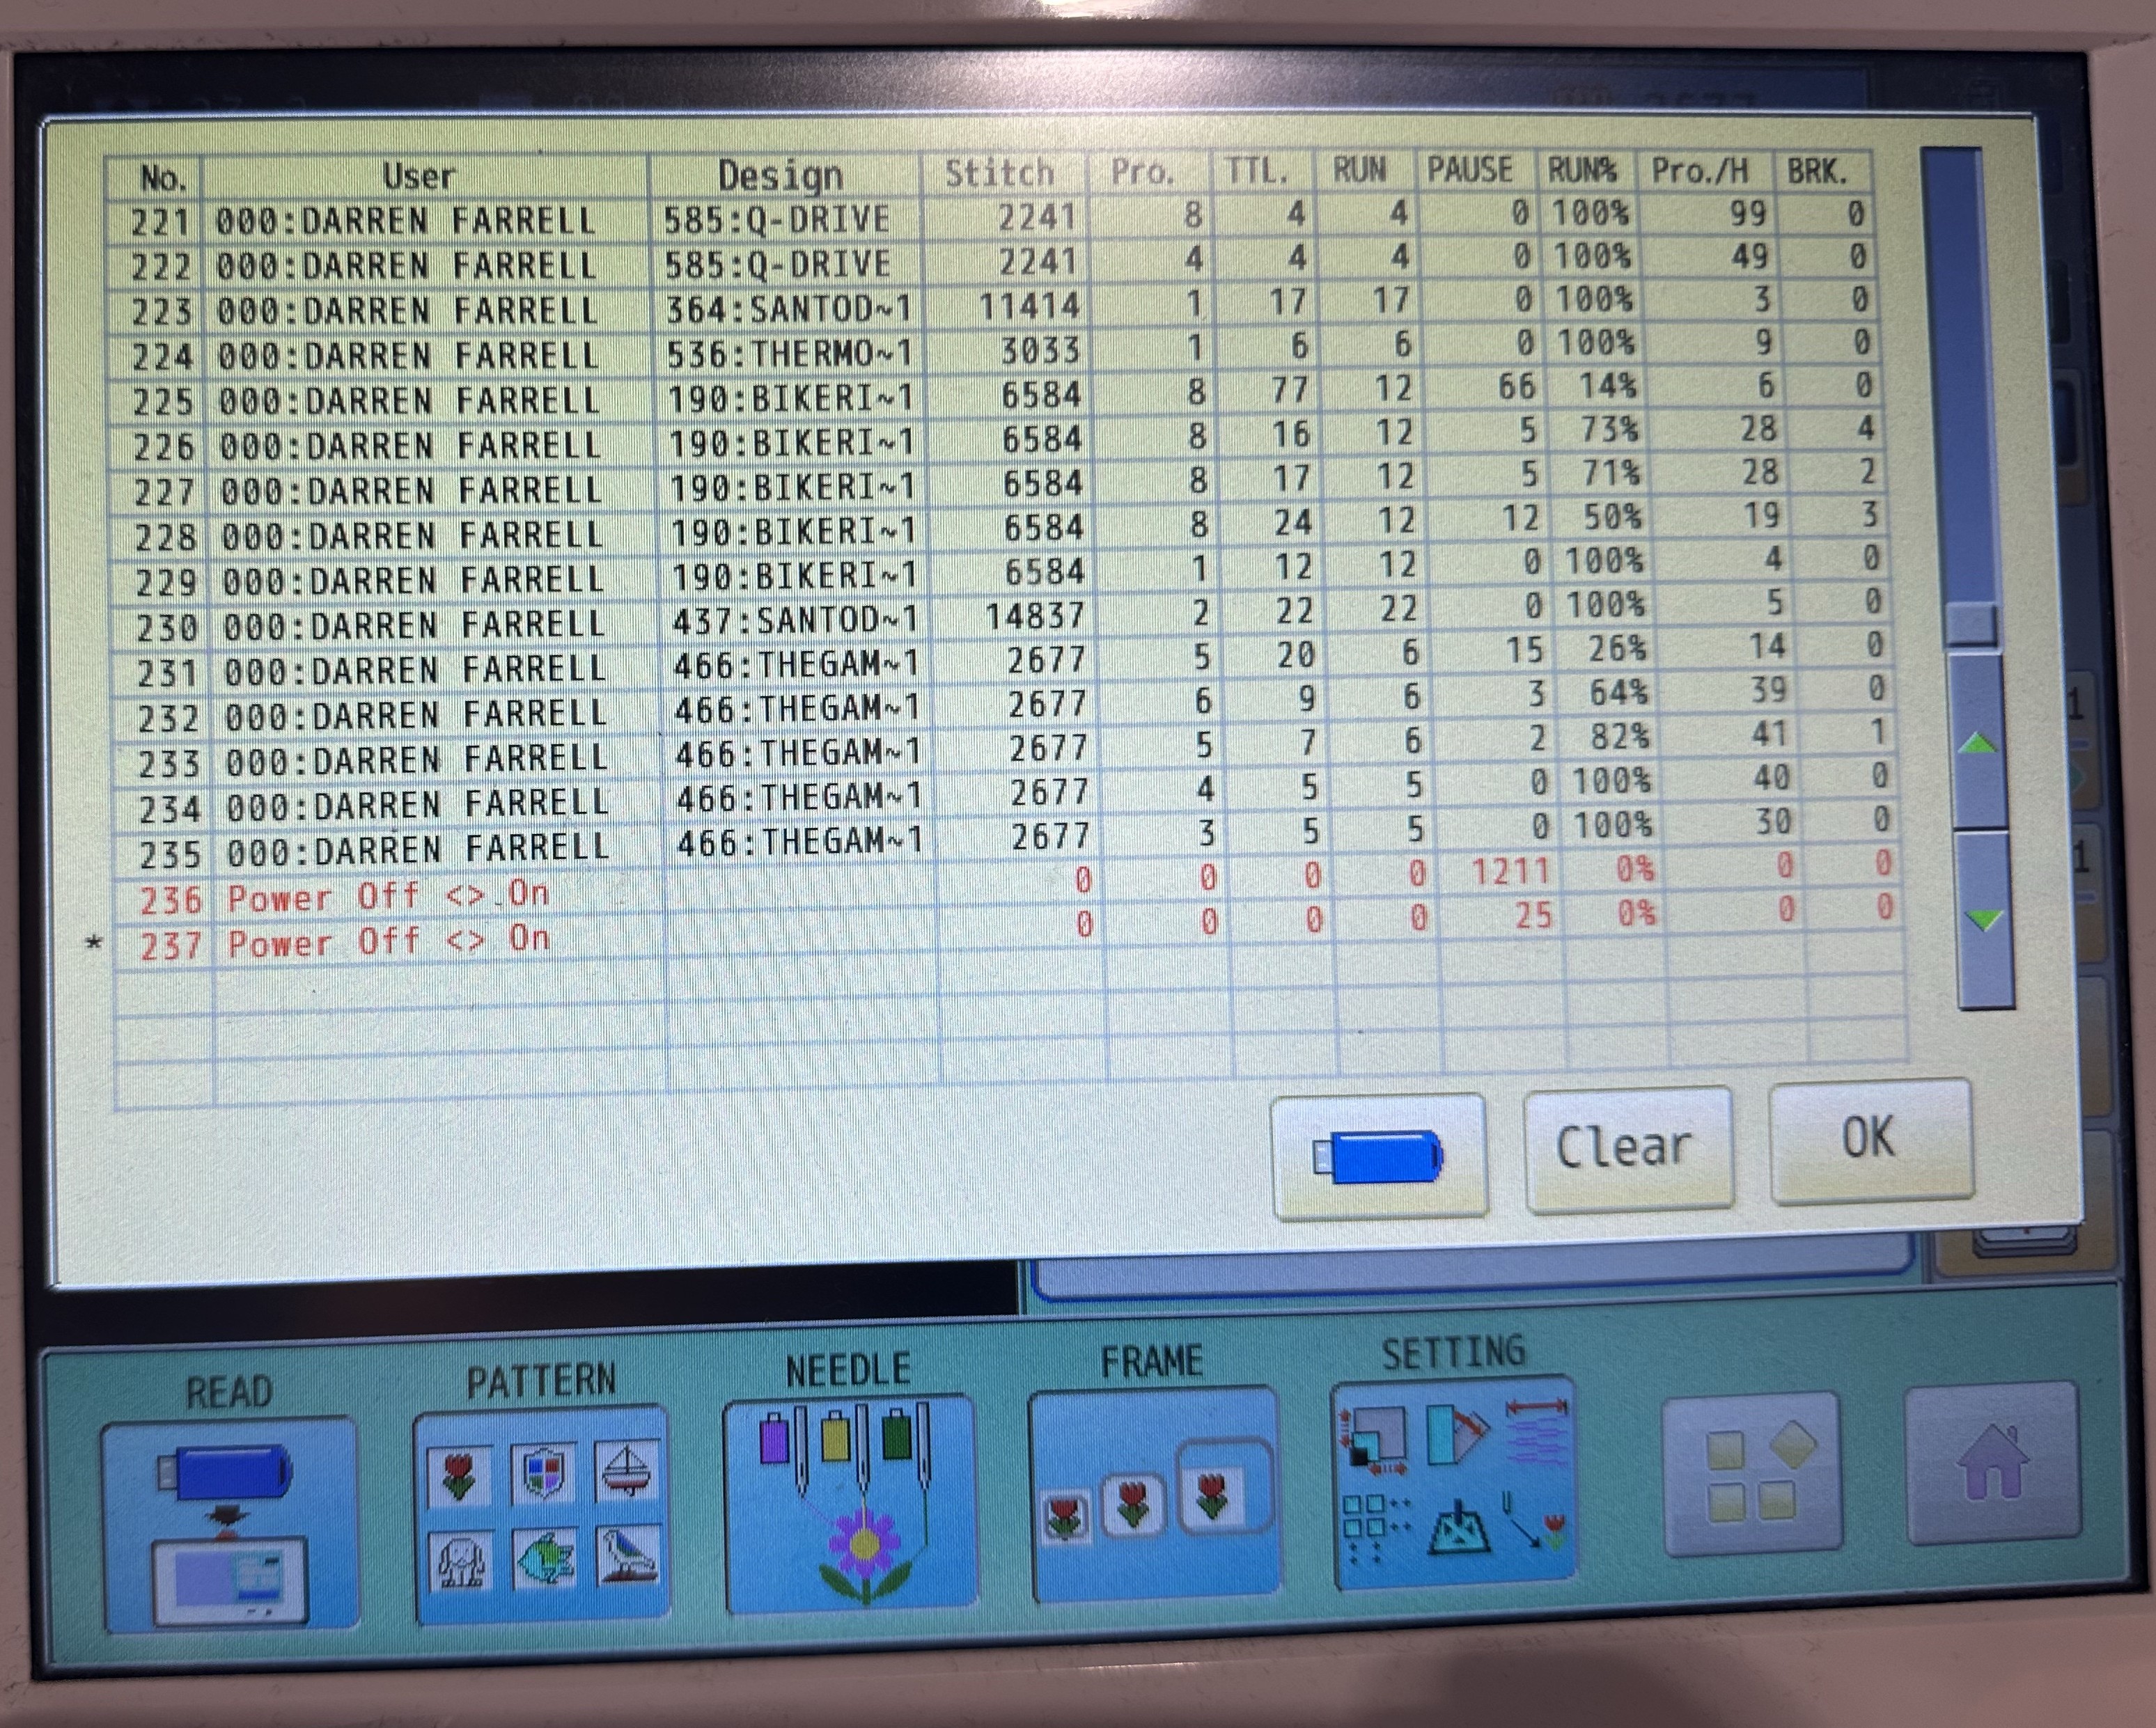
The fix was a Raspberry Pi wired to each machine as a USB gadget, presenting itself to the HCR3 simultaneously as a mouse and a flash drive: it can drive the machine's own touchscreen menus programmatically and then receive the exported CSV the machine writes to it, without the machine ever knowing it isn't talking to a human with a USB stick. An NFC tap on the shop floor is what triggers the pull, so an operator finishing a job taps a tag, the Pi navigates the report menu and grabs the CSV, and the data is in the database moments later with no one having stood at the machine on purpose to extract it.
Job tracking, and its access boundary
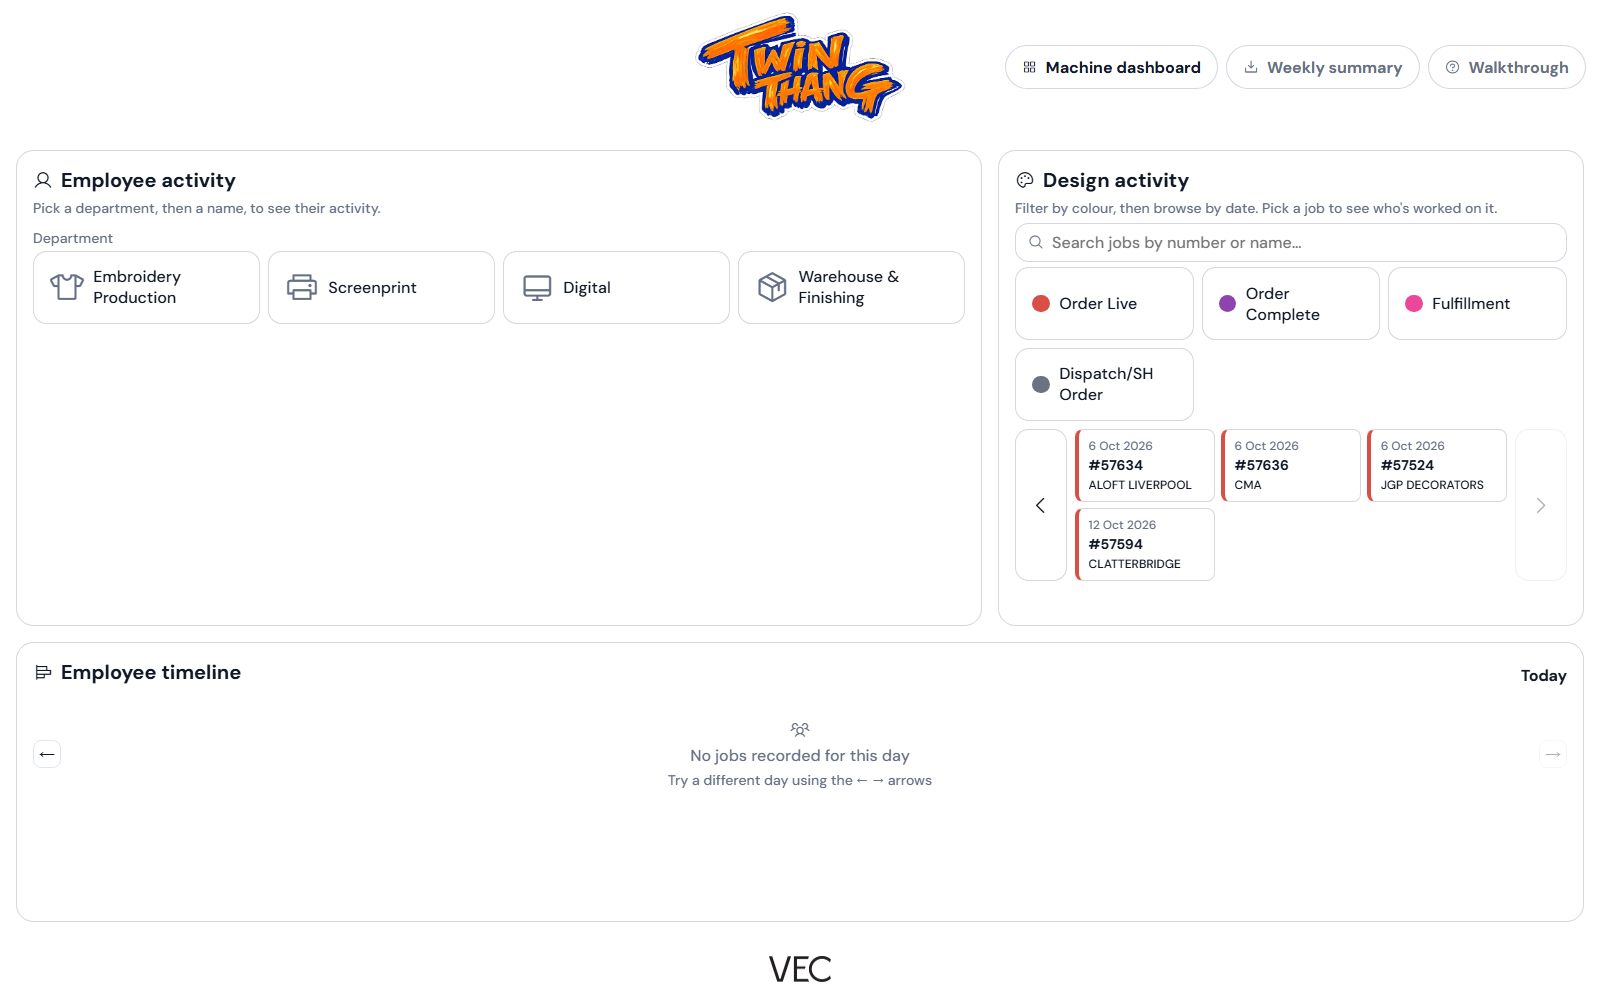
A second, complementary use of the NFC taps tracks how people move from job to job across the day, aimed at optimising downtime and triaging bottlenecks rather than at production data itself. Job and order information arrives by email rather than through any structured feed, so a reader built on the Microsoft Graph Mail API pulls job emails directly, alongside a calendar reader for scheduling information.

The job-movement data sits in a separate Job History view. It shows activity by department and employee, design jobs filtered by their Outlook calendar category (order live, order complete, fulfilment, dispatch), and a day-by-day employee timeline. The dashboard and Job History both sit behind a shared password screen, and the NFC page is only reachable over the company's private Tailscale network, because it shows staff names.
An assistant that isn't allowed to make numbers up
The assistant is a five-stage pipeline, not a single LLM call: a planner turns the question into a structured analysis request (entities, measures, dimensions, filters, required tools), a validator checks that request against a data catalog of what actually exists before anything runs, an executor calls the real tools and is the only place any number gets computed, an answer composer turns those results into prose without doing any computation of its own, and a critic does a final independent check, including tracing every number in the drafted answer back to a real tool result by value, before it's allowed to reach the user. If the critic fails it, the assistant asks a clarifying question rather than returning the answer.
The planning step itself is deterministic-first: a glossary maps words and phrases (not whole canned questions) to known concepts, so new phrasings of an existing question route correctly without needing a hardcoded string added for every variant, with an optional LLM-assist pass to refine the plan further, itself filtered back through the same catalog vocabulary before being trusted. That data catalog also encodes what isn't real: there's no per-embroidery-head fault log, for instance, so the Gantt view's per-head rows are documented as a client-side visual heuristic (jobs packed into lanes by overlapping time) rather than measured data, and a question like "why does the Gantt only show two heads" gets an honest explanation of that heuristic instead of a fabricated head count. Where a requested measure genuinely doesn't exist, the validator substitutes a real, documented fallback (a missing stop-event count, for example, gets answered from lost time plus thread breaks plus errors instead) rather than the assistant inventing a plausible-sounding number.

CCTV as a further, independent data source
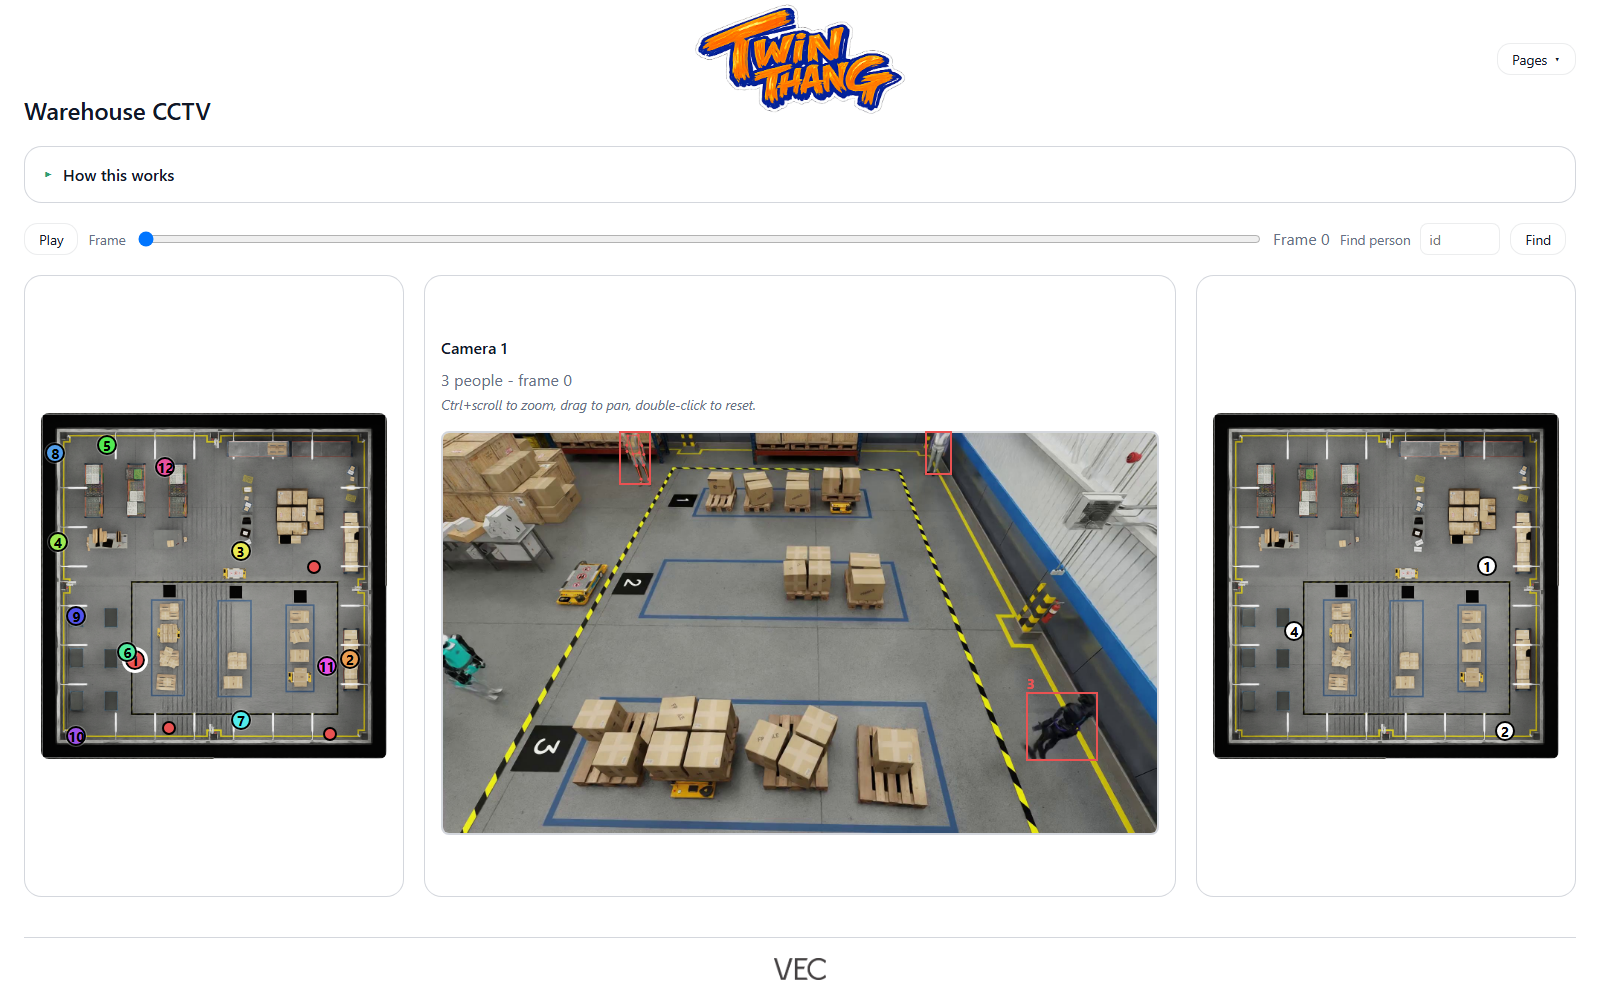
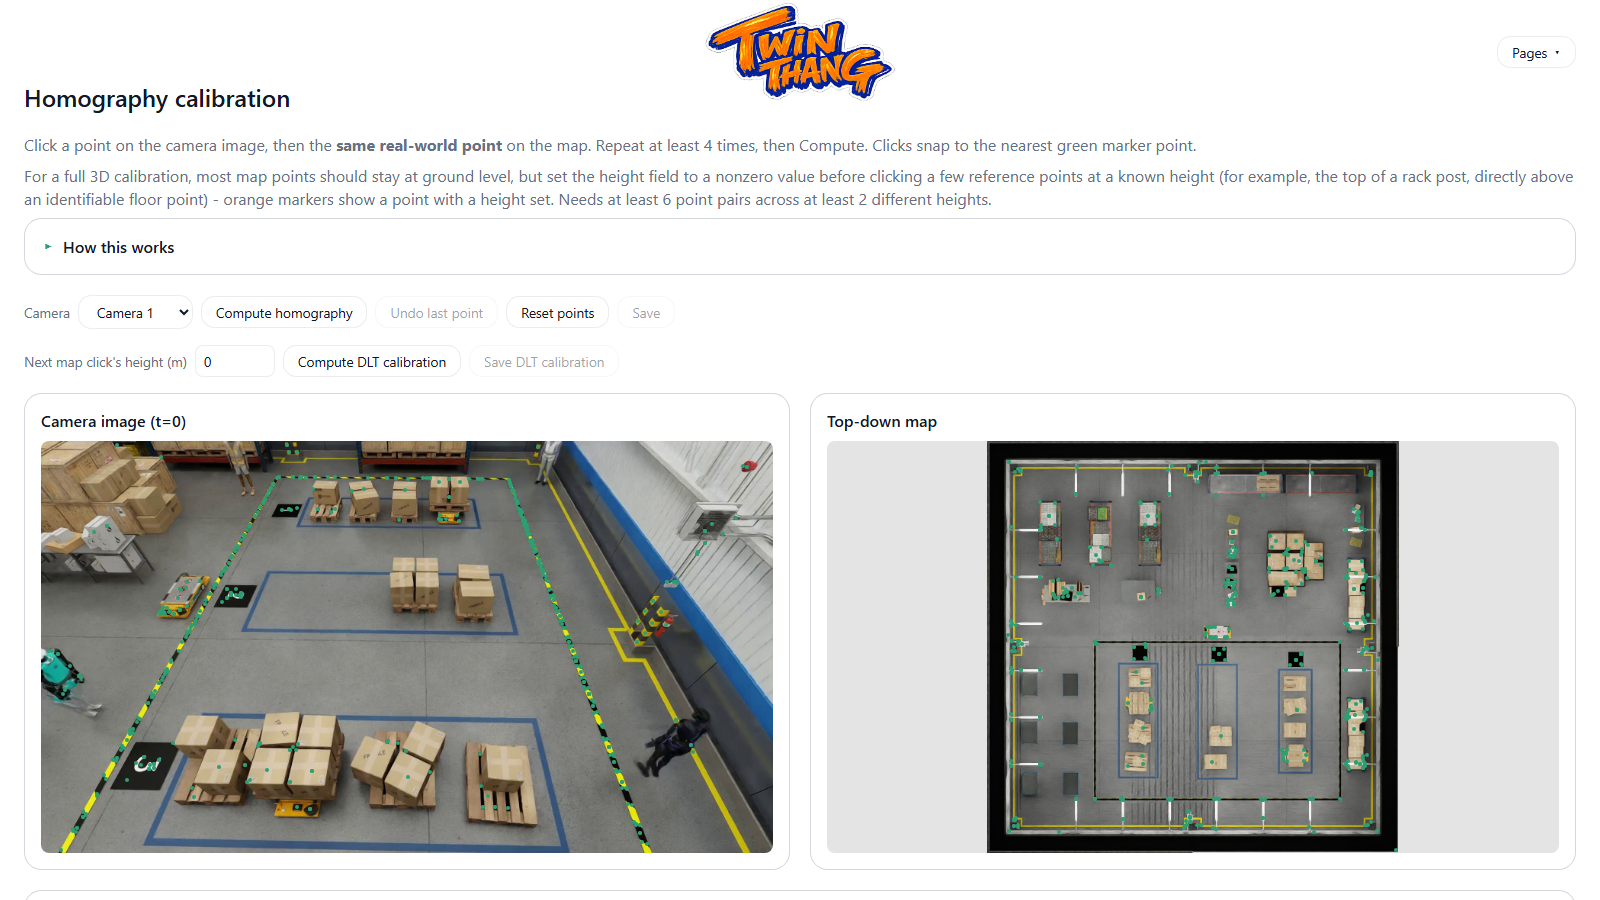
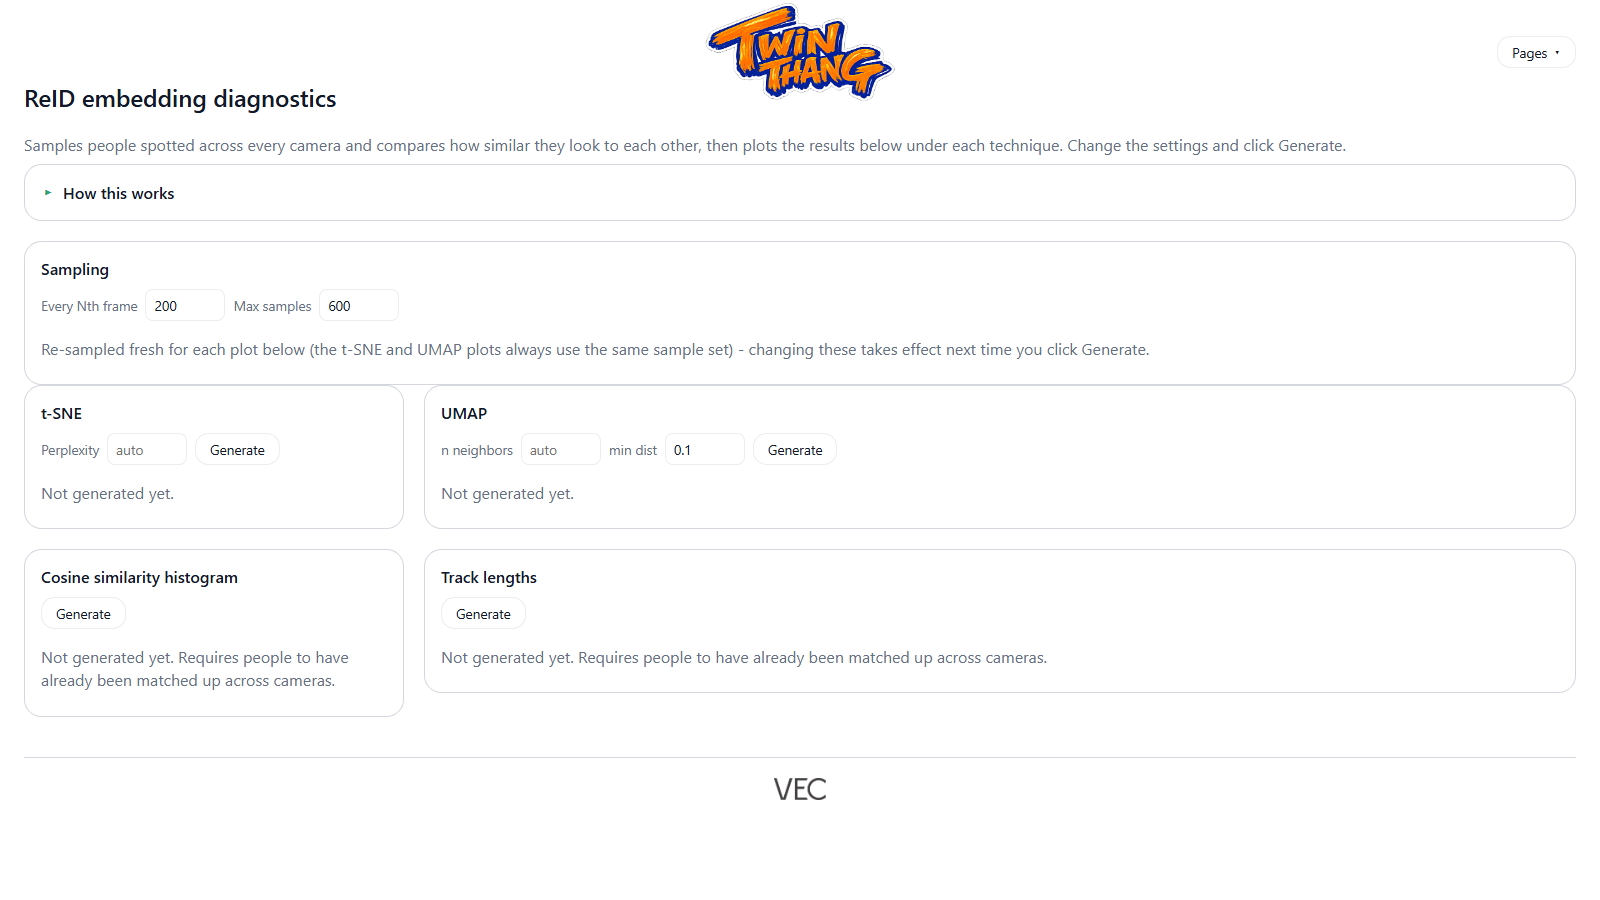
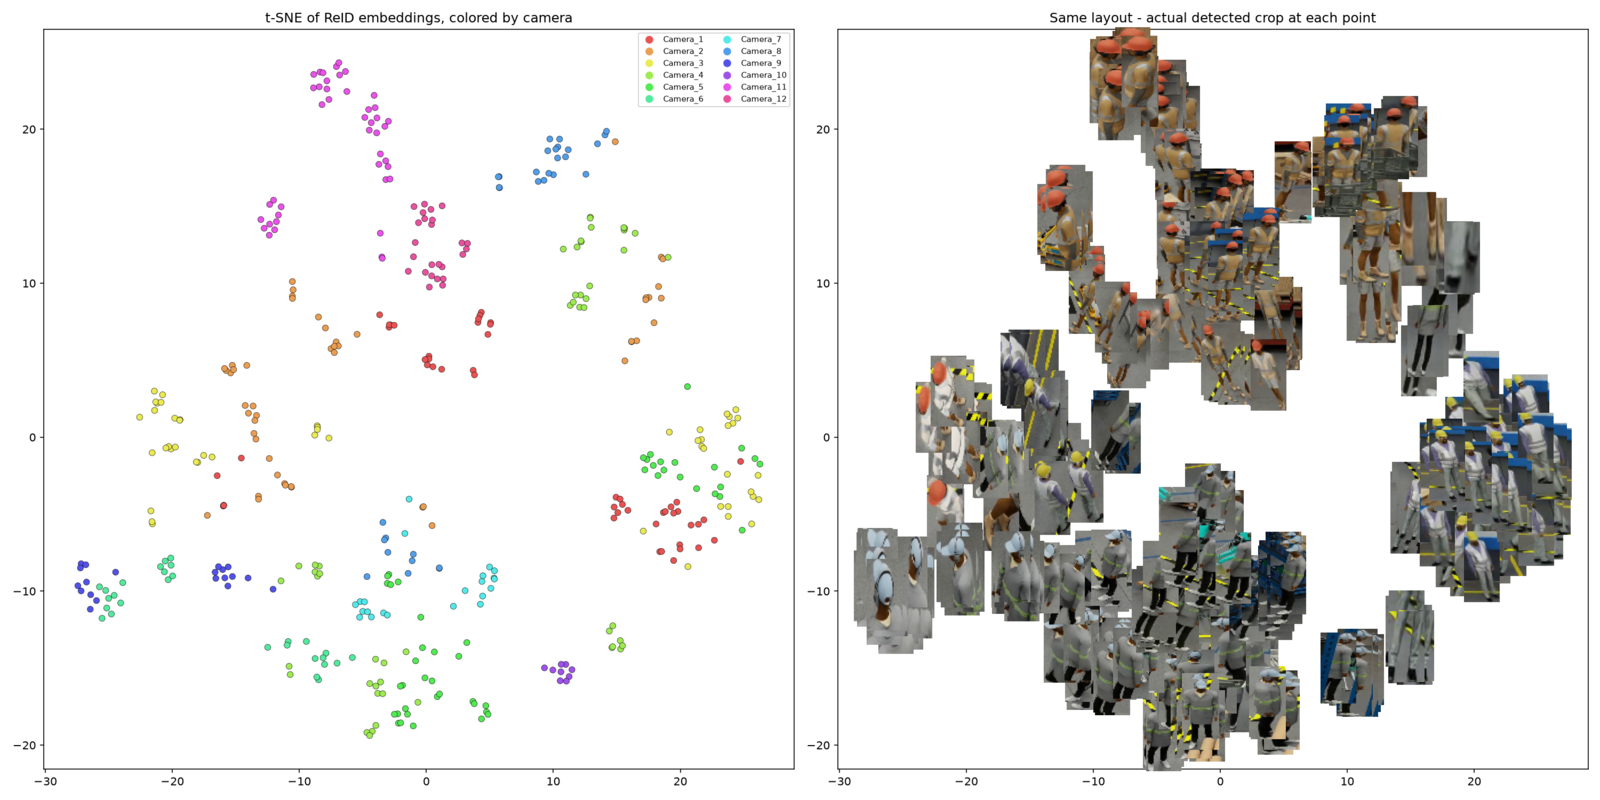
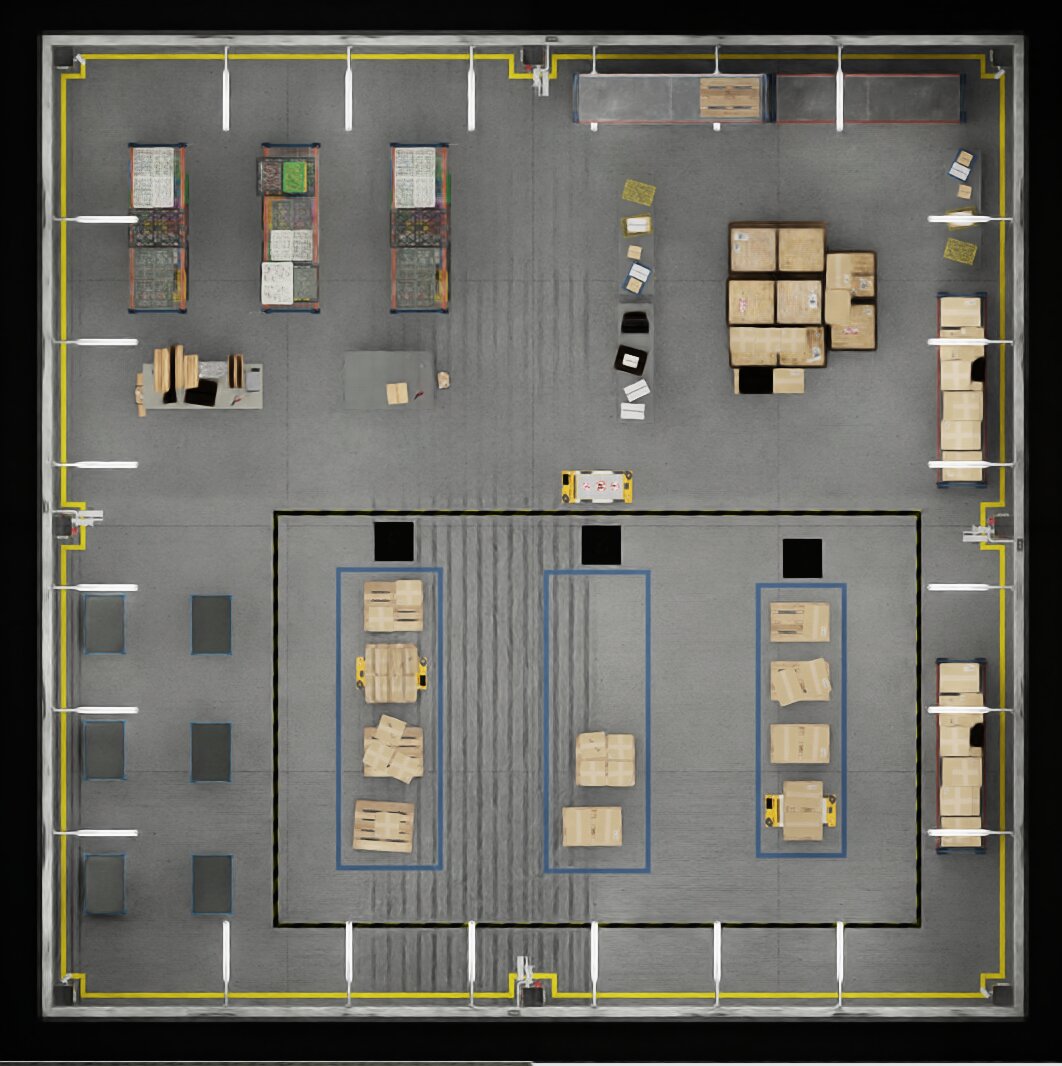
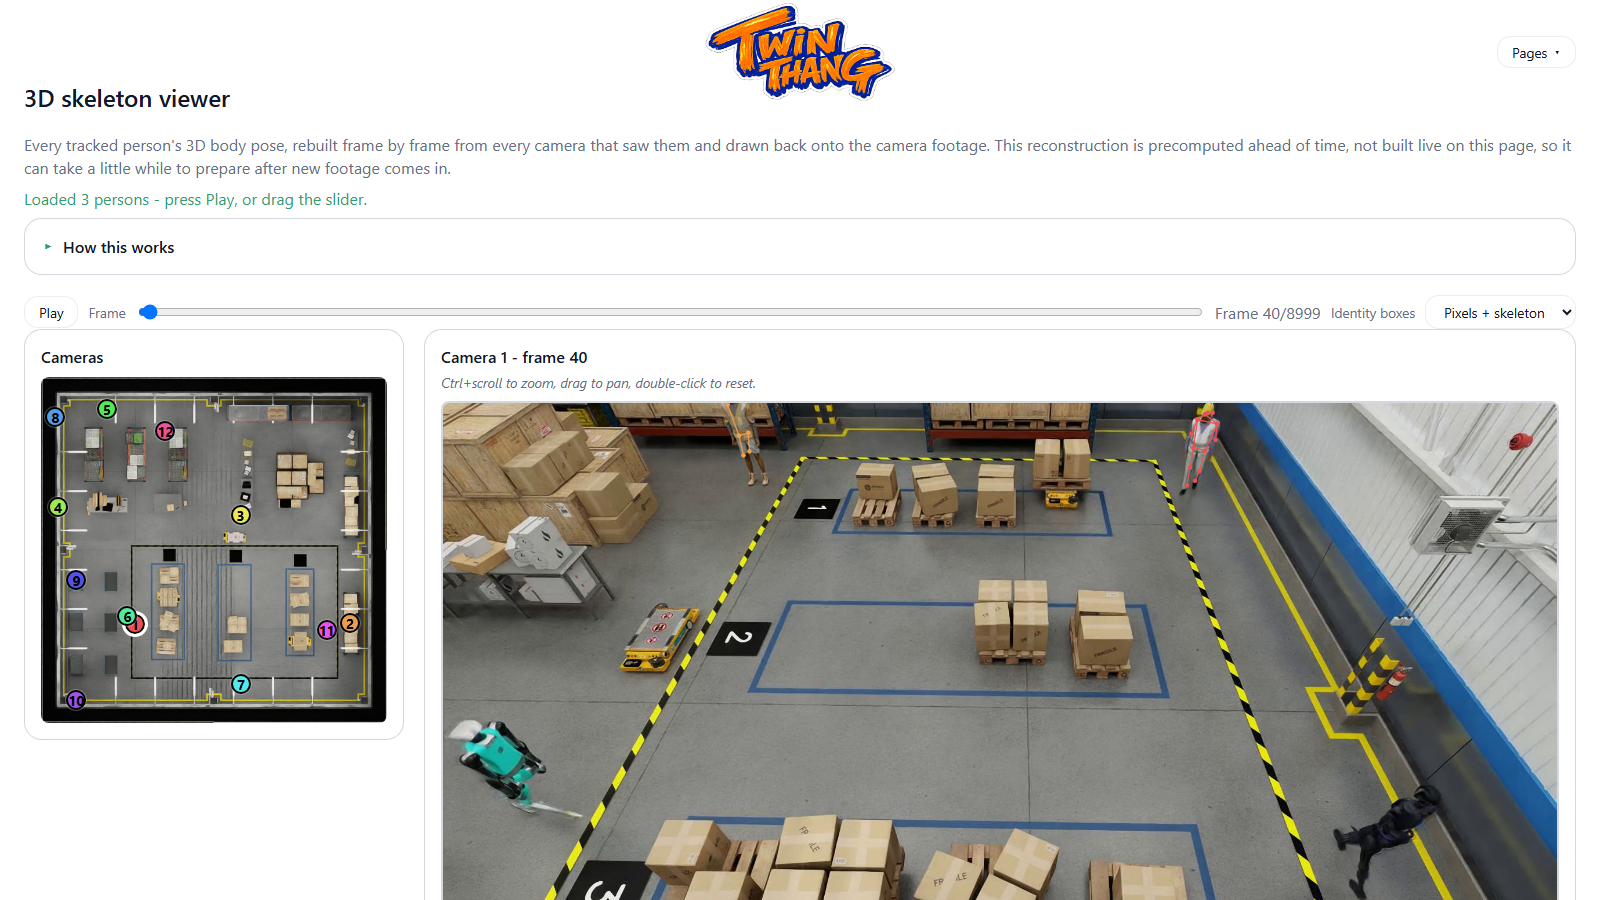
The client's existing CCTV network covers the shop floor already, which raises an obvious question: could it inform layout decisions the machine logs and NFC taps can't, by tracking how people actually move between stations rather than only when they tap a tag. The MCMT prototype, built and validated on an open-source multi-camera dataset before pointing it at anything client-specific, chains four stages: homography calibration to project every camera's view onto a shared floor plane, YOLO-based person detection per camera, cross-camera re-identification (Re-ID) to keep a consistent identity for the same person across overlapping views, and 3D pose triangulation from the resulting multi-view detections.
Headline results
- Live per-machine dashboard (3D factory layout, current job, predicted completion time with a confidence level, utilisation split into run/interval/pause) driven directly from the machines' own logs.
- A Raspberry Pi USB-gadget bridge (presenting as a mouse and flash drive) turns an API-less machine's manual USB export into an NFC-tap-triggered automatic pull, closing the hardware data gap without any cooperation from the machine vendor.
- Three-tier alerts from thread-break and idle-time rules, per-job completion predictions with a stated confidence, and a print-ready weekly summary for production meetings.
- NFC-based operator and job tracking with resilient offline queueing on the reader Pi, so network drops at the machine don't cost attendance or job-selection data.
- A separate job-movement tracker, built on the Microsoft Graph Mail and Calendar APIs for order and scheduling data, kept behind a shared password screen, with the NFC page reachable only over a private network.
- An integrated AI assistant answering natural-language questions about the floor by querying live production and NFC data through its own tool set, rather than a static report.
- Design-level analytics (job count, output, run ratio, lost minutes) ranked and searchable per embroidery design, surfacing which designs are actually costing the most machine time.
- A working MCMT prototype (homography calibration, YOLO detection, cross-camera Re-ID, 3D pose triangulation) validated on an open dataset, as a prospective further data source independent of the machine logs and NFC taps.
Discussion