UK Spin-out Tracker
An interactive dashboard for exploring UK university spin-out activity: where spin-outs are founded, who's funding them, and how that connects back to each institution's own research income, built on real HESA, UKRI, and Companies House data rather than survey estimates.
Purpose and audience
I built the tracker during my internship at the Virtual Engineering Centre (VEC), University of Liverpool. It connects UK university spin-out activity to each institution's income and research funding, and it was designed around four questions:
- Where are spin-outs founded, and who funds them?
- How does that connect to an institution's research income?
- Which institutions are strongest by return on investment and financial health?
- Is current funding healthy, and does it predict start-ups?
The intended users are university finance and research offices, technology transfer and commercialisation offices, institutional leadership, policymakers and funders such as Research England and UKRI, venture capital investors, and regional business and investment officers.
What it covers
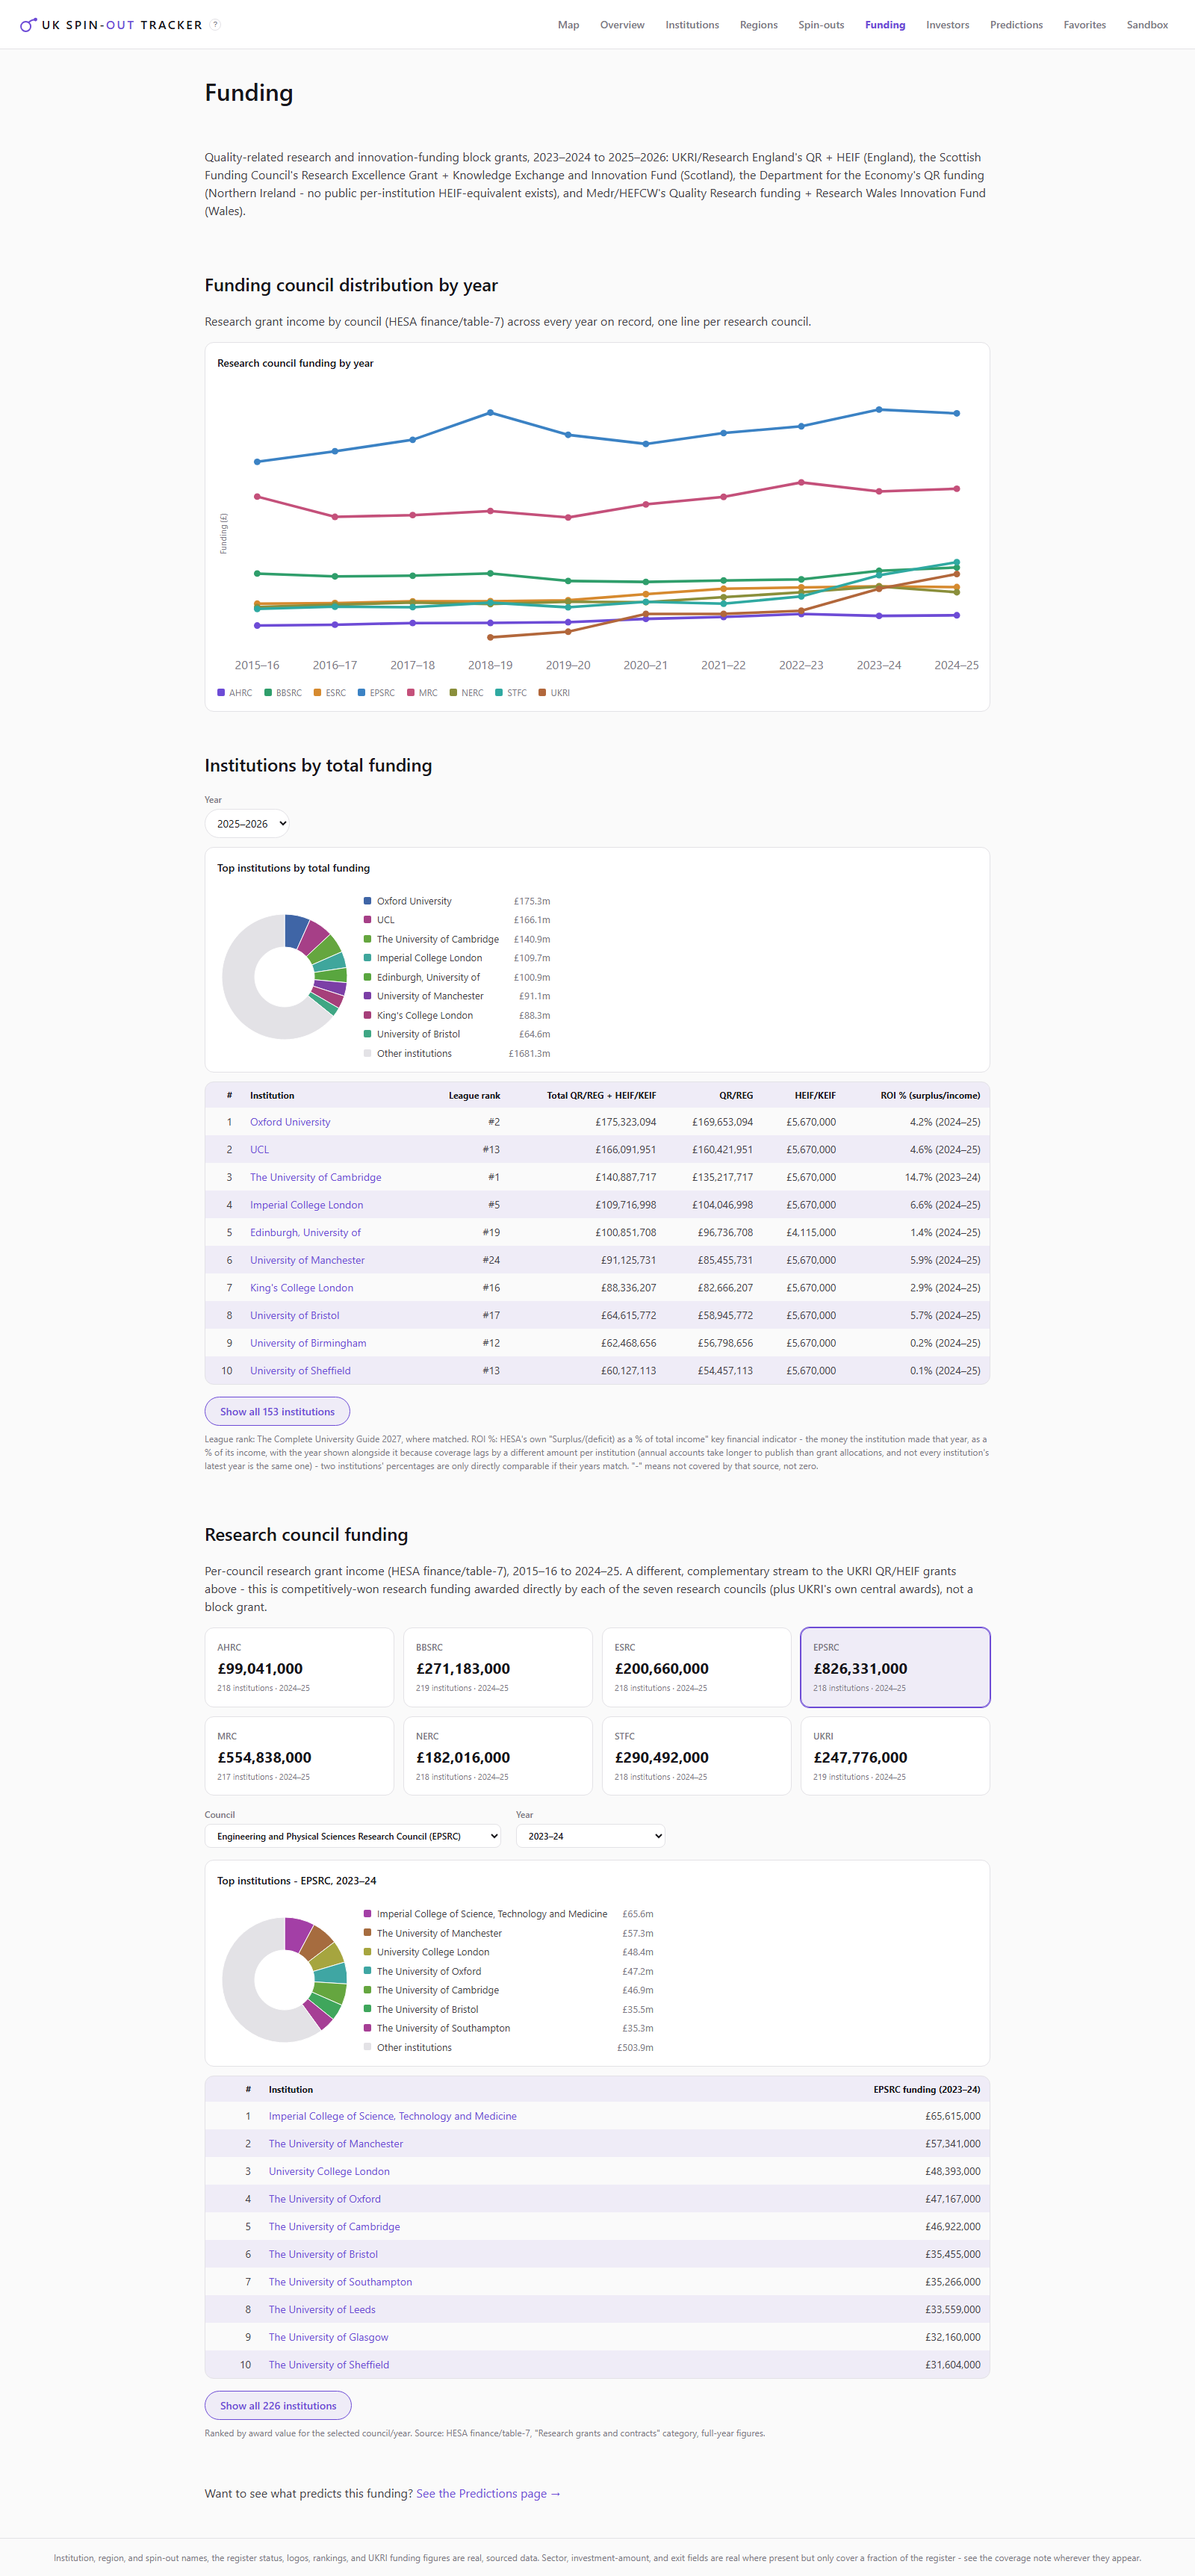
The dashboard sits on top of a DuckDB data warehouse built from raw HESA and UKRI downloads, with a separate pipeline enriching the HESA spin-out register itself using Companies House filings and web search, since the register alone doesn't say much about what a given spin-out actually does or how it's funded. A FastAPI backend serves live queries over that warehouse (research council income, institution income and expenditure, a chart assistant) alongside a set of trained models: a funding-prediction model and a survival model, both used to compare an institution's actual research council income against what its size and profile alone would predict. The frontend (React 19 + Vite + TypeScript) turns that into the interactive dashboard: per-institution funding tables, per-research-council predictability charts, and drill-down explanations of individual figures.
Every one of the 70 institutions in scope, University of Liverpool included, gets its own drill-down report generated live from the warehouse rather than as a static document: income and expenditure trends over time, predicted-versus-actual research council funding, and spin-out activity attributed back to that institution specifically.
Enriching the spin-out register itself
HESA's own spin-out register records that a company exists and which institution it came from, and not much else, no sector, no funding history, no exit status. A separate enrichment pipeline fills that in for roughly 2,500 companies: each one is resolved to a Companies House company number, then a set of enrichment agents append what they find, sector classification, investment events (both a full historical backfill and an ongoing incremental diff), and exit signals (acquisition, dissolution, and so on), to an append-only SQLite fact store, corroborating with web search where Companies House filings alone don't settle a question. Nothing is overwritten, so the provenance of any given fact stays inspectable; the latest fact per company is then joined back against the original register and exported into the warehouse, and from there into the static JSON the frontend actually bundles.
Guided tour
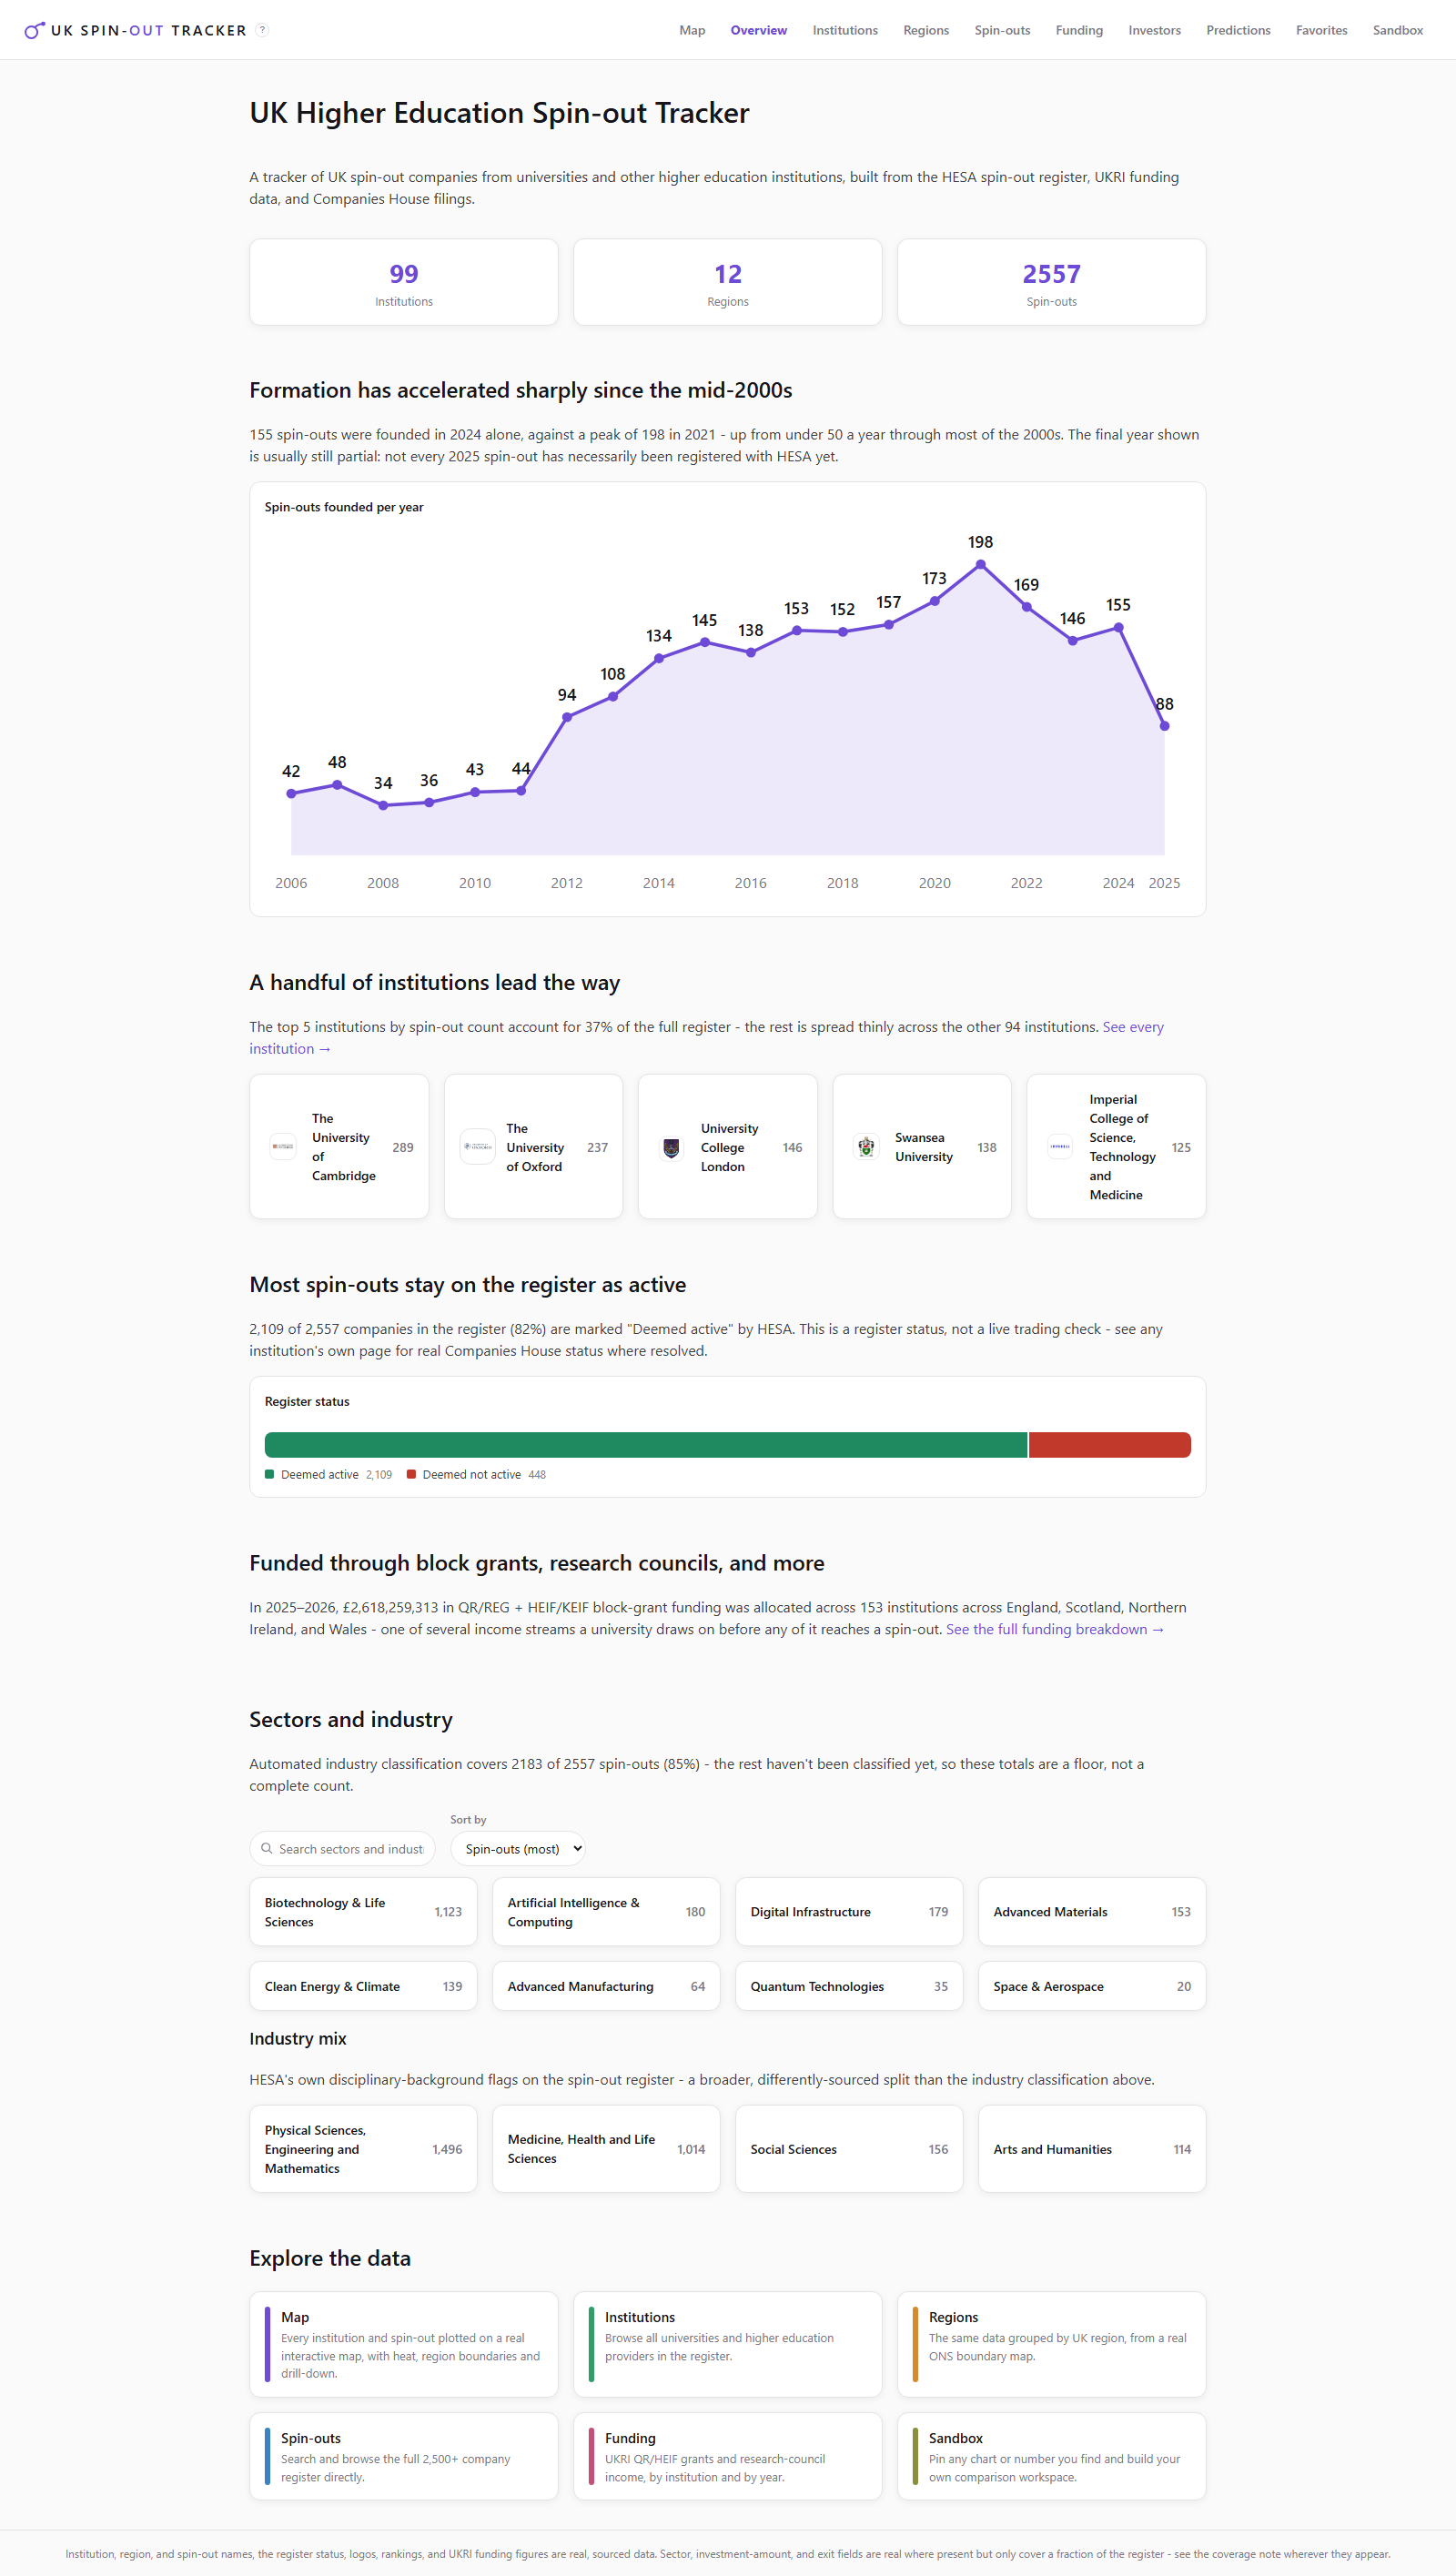
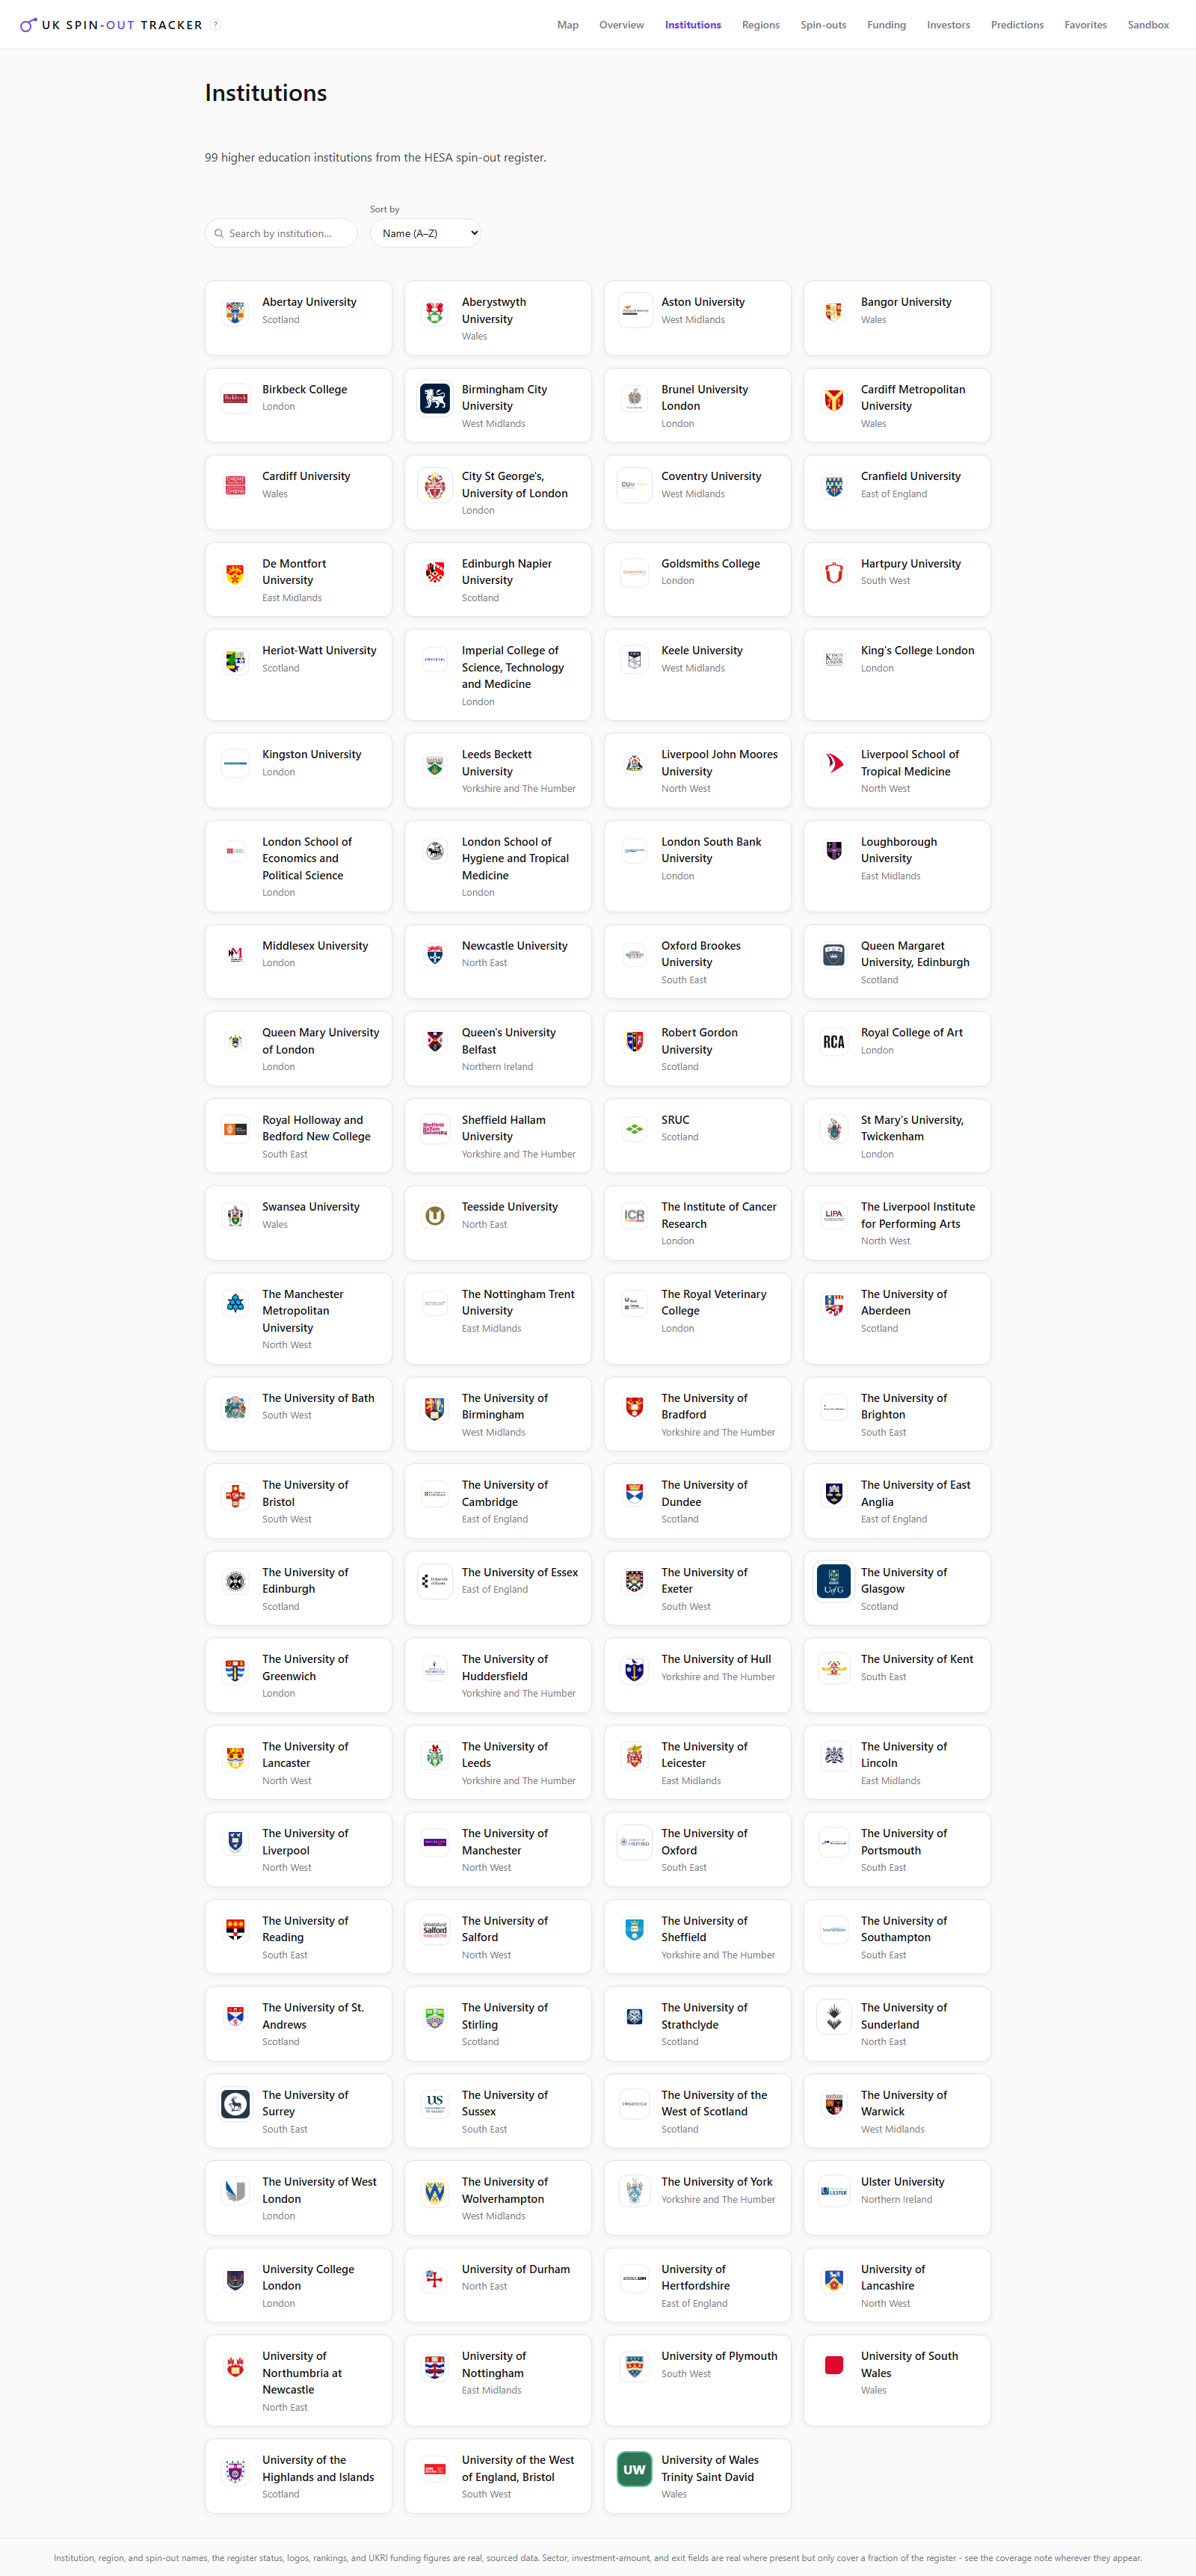
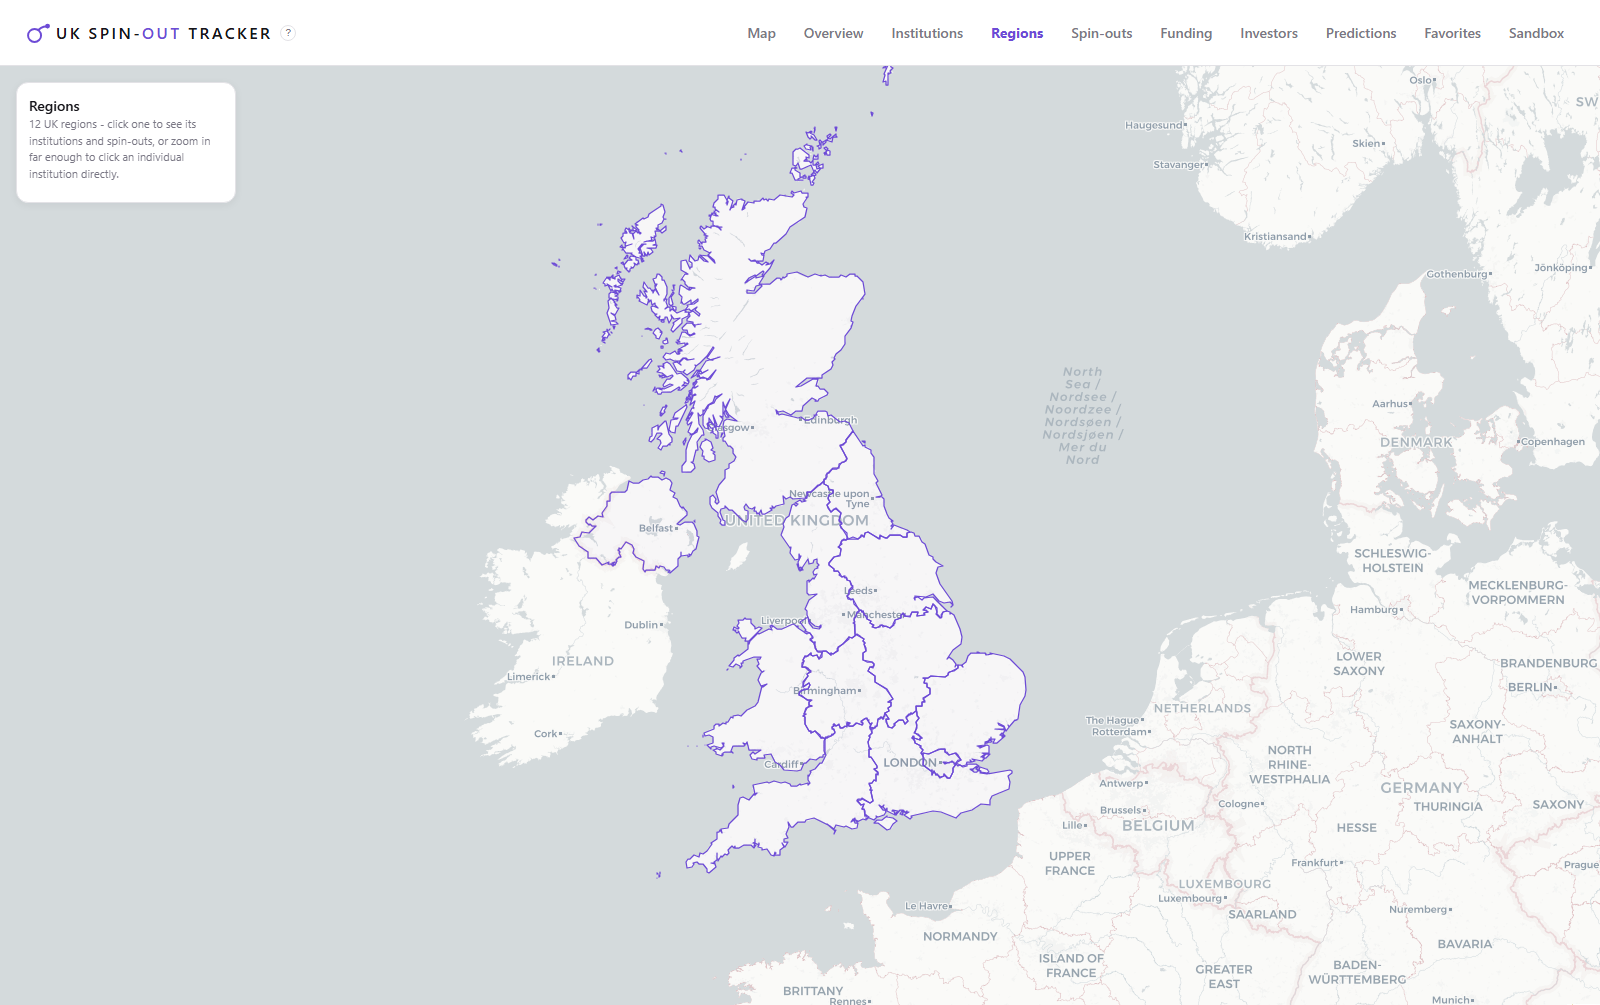
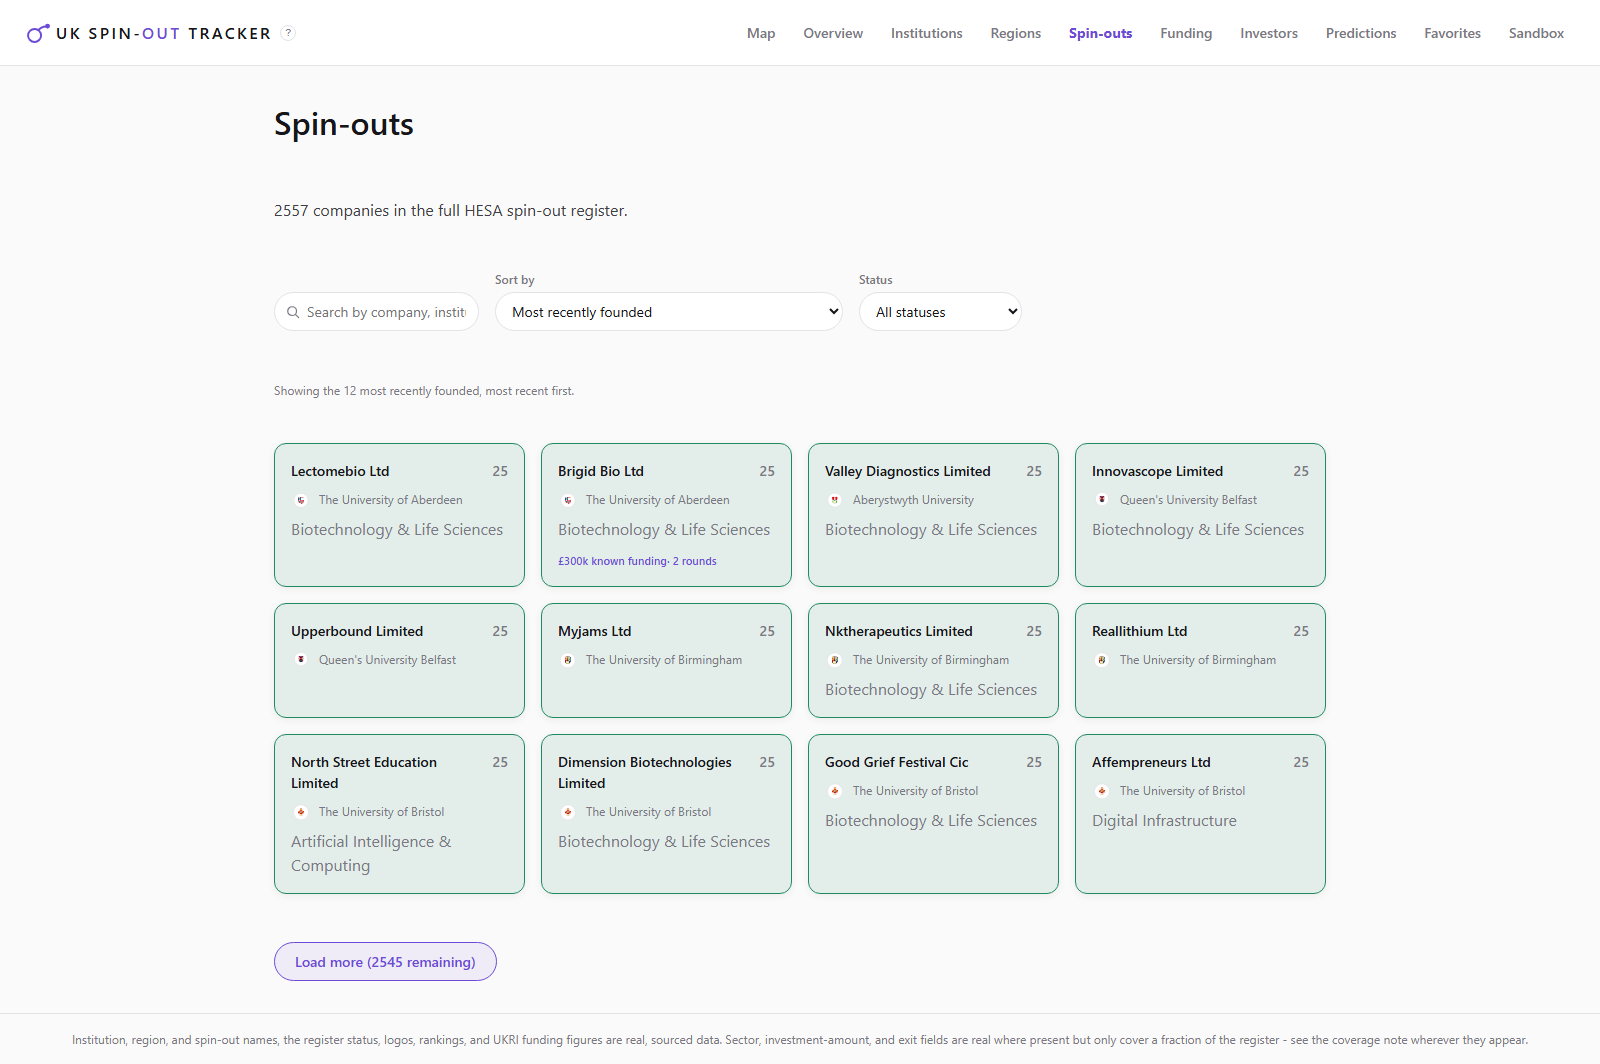
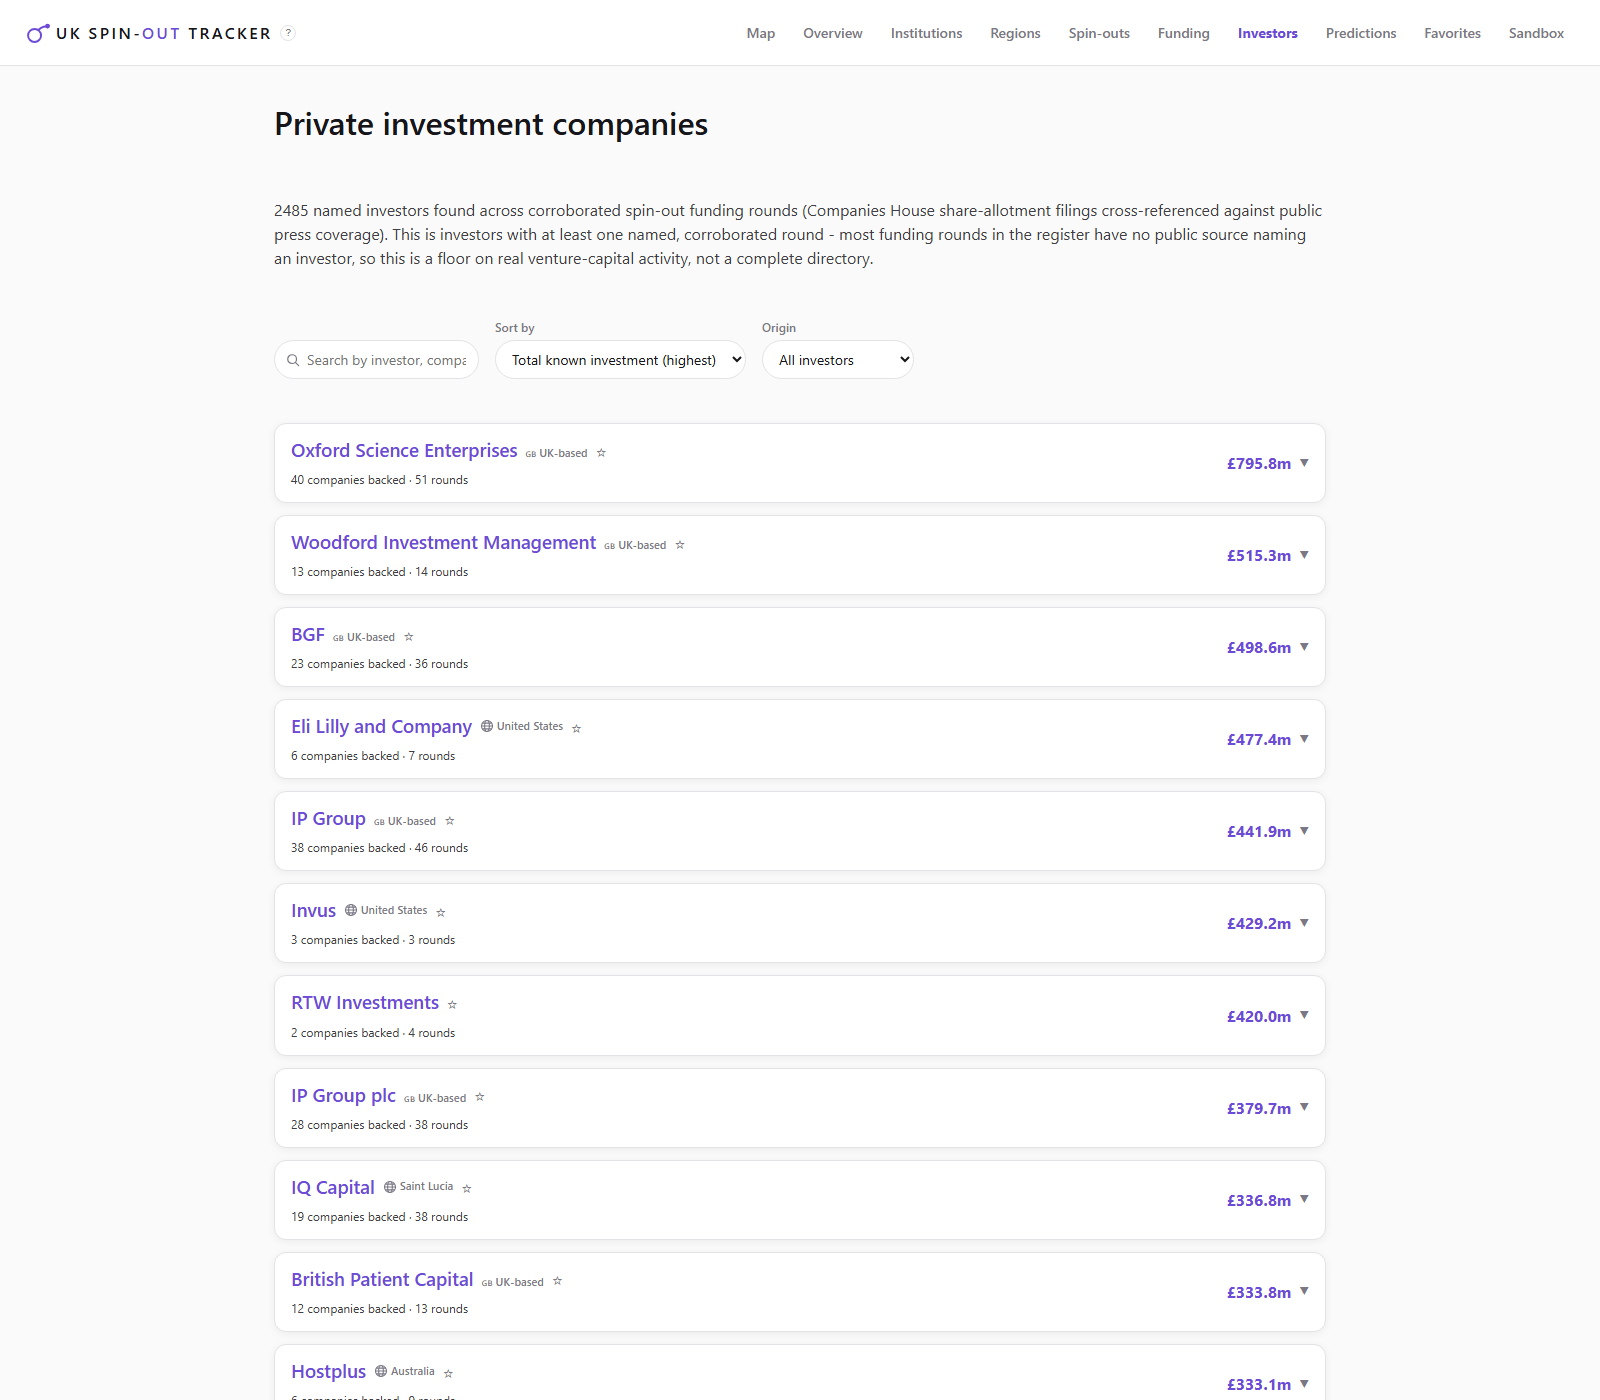
From the map above, the same nav bar walks through every other view.
Analysis for the University of Liverpool
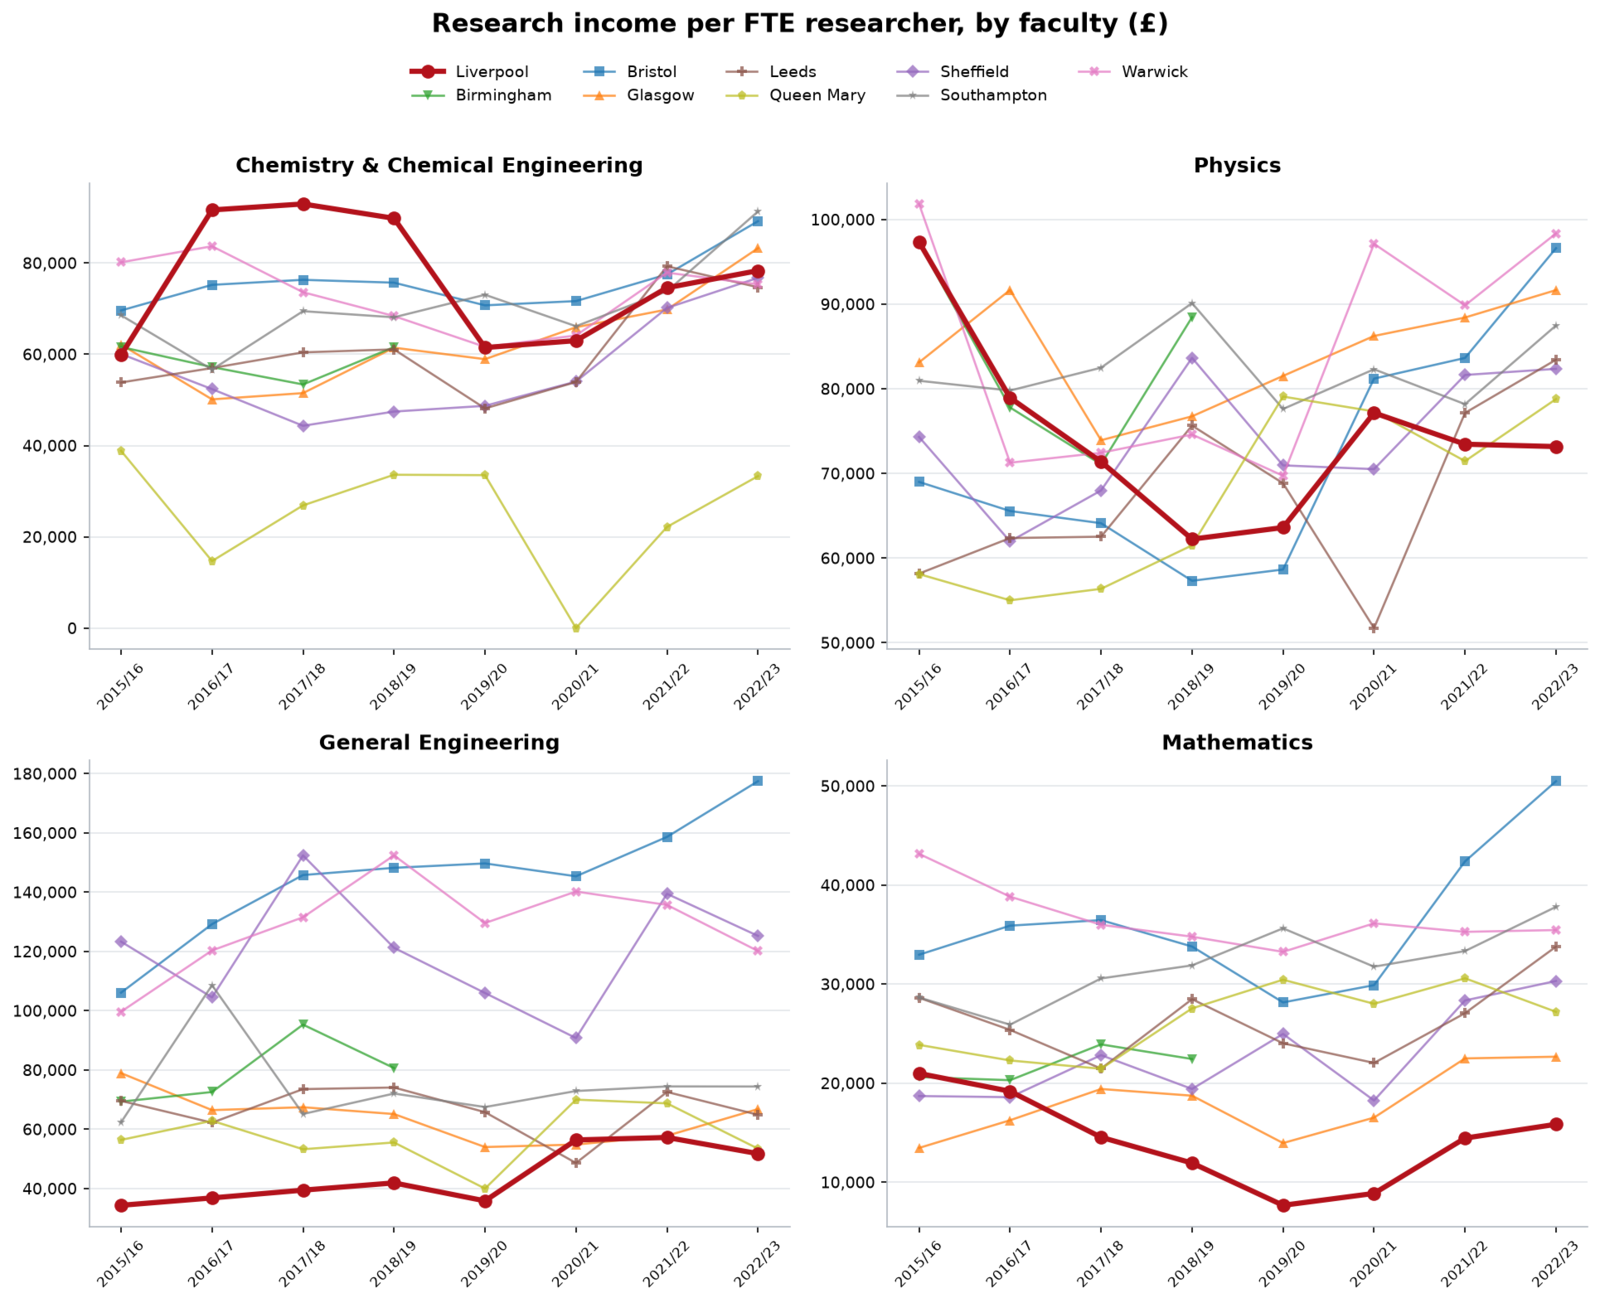
The same warehouse supported two longer analyses for the University of Liverpool, delivered as reports with accompanying figure packages. The figure below is an example finding from the dashboard's data: research income per FTE researcher by faculty, against a set of peer universities.
- Grant allocation. Examines research funding levels across Liverpool's science and engineering departments, differences between departments, how concentrated award value is among individual grant-holders, dependence on particular research councils, and how reliably departmental income can be forecast. Methods include log-linear growth models with partial pooling across institutions, hierarchical models, backtests of competing forecasts, and two classifiers that assign UKRI awards to departments, combined through an agreement rule and validated externally.
- Times Higher Education rankings. Examines Liverpool's position in the THE World University Rankings 2026 and the gap to the top 100: which parts of the composite score can be reconstructed from institutional data and which cannot (reputation, citations and international co-authorship among them), where the available evidence supports action, and how research income, subject mix, pay, bibliometrics, and REF results compare with funding peers.
Both reports were written for the university, so they are behind a password.
Research grant allocation: the University of Liverpool in comparison with the Russell Group
Institutional funding and citation performance at the University of Liverpool
Headline results
- A reproducible data pipeline (raw HESA/UKRI downloads → DuckDB warehouse → both a live query API and static frontend datasets) rather than a one-off spreadsheet analysis.
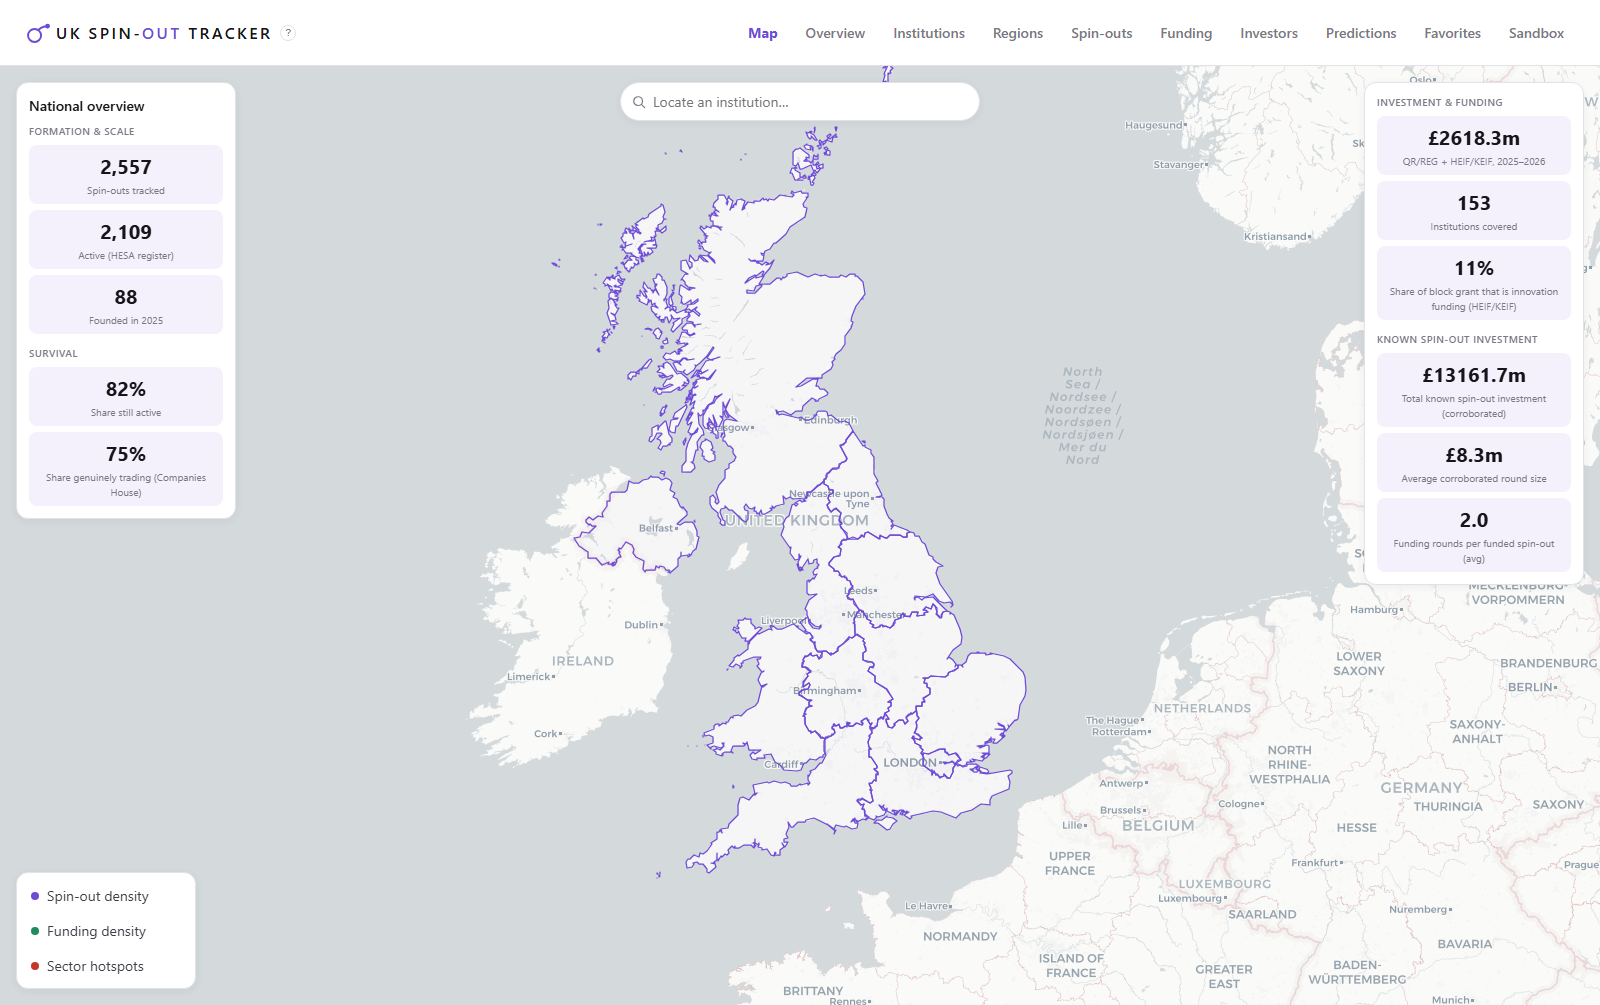
- A geocoded national map as the default view, surfacing spin-out density, funding density, and sector hotspots by region alongside live formation and investment totals, rather than requiring an institution search first.
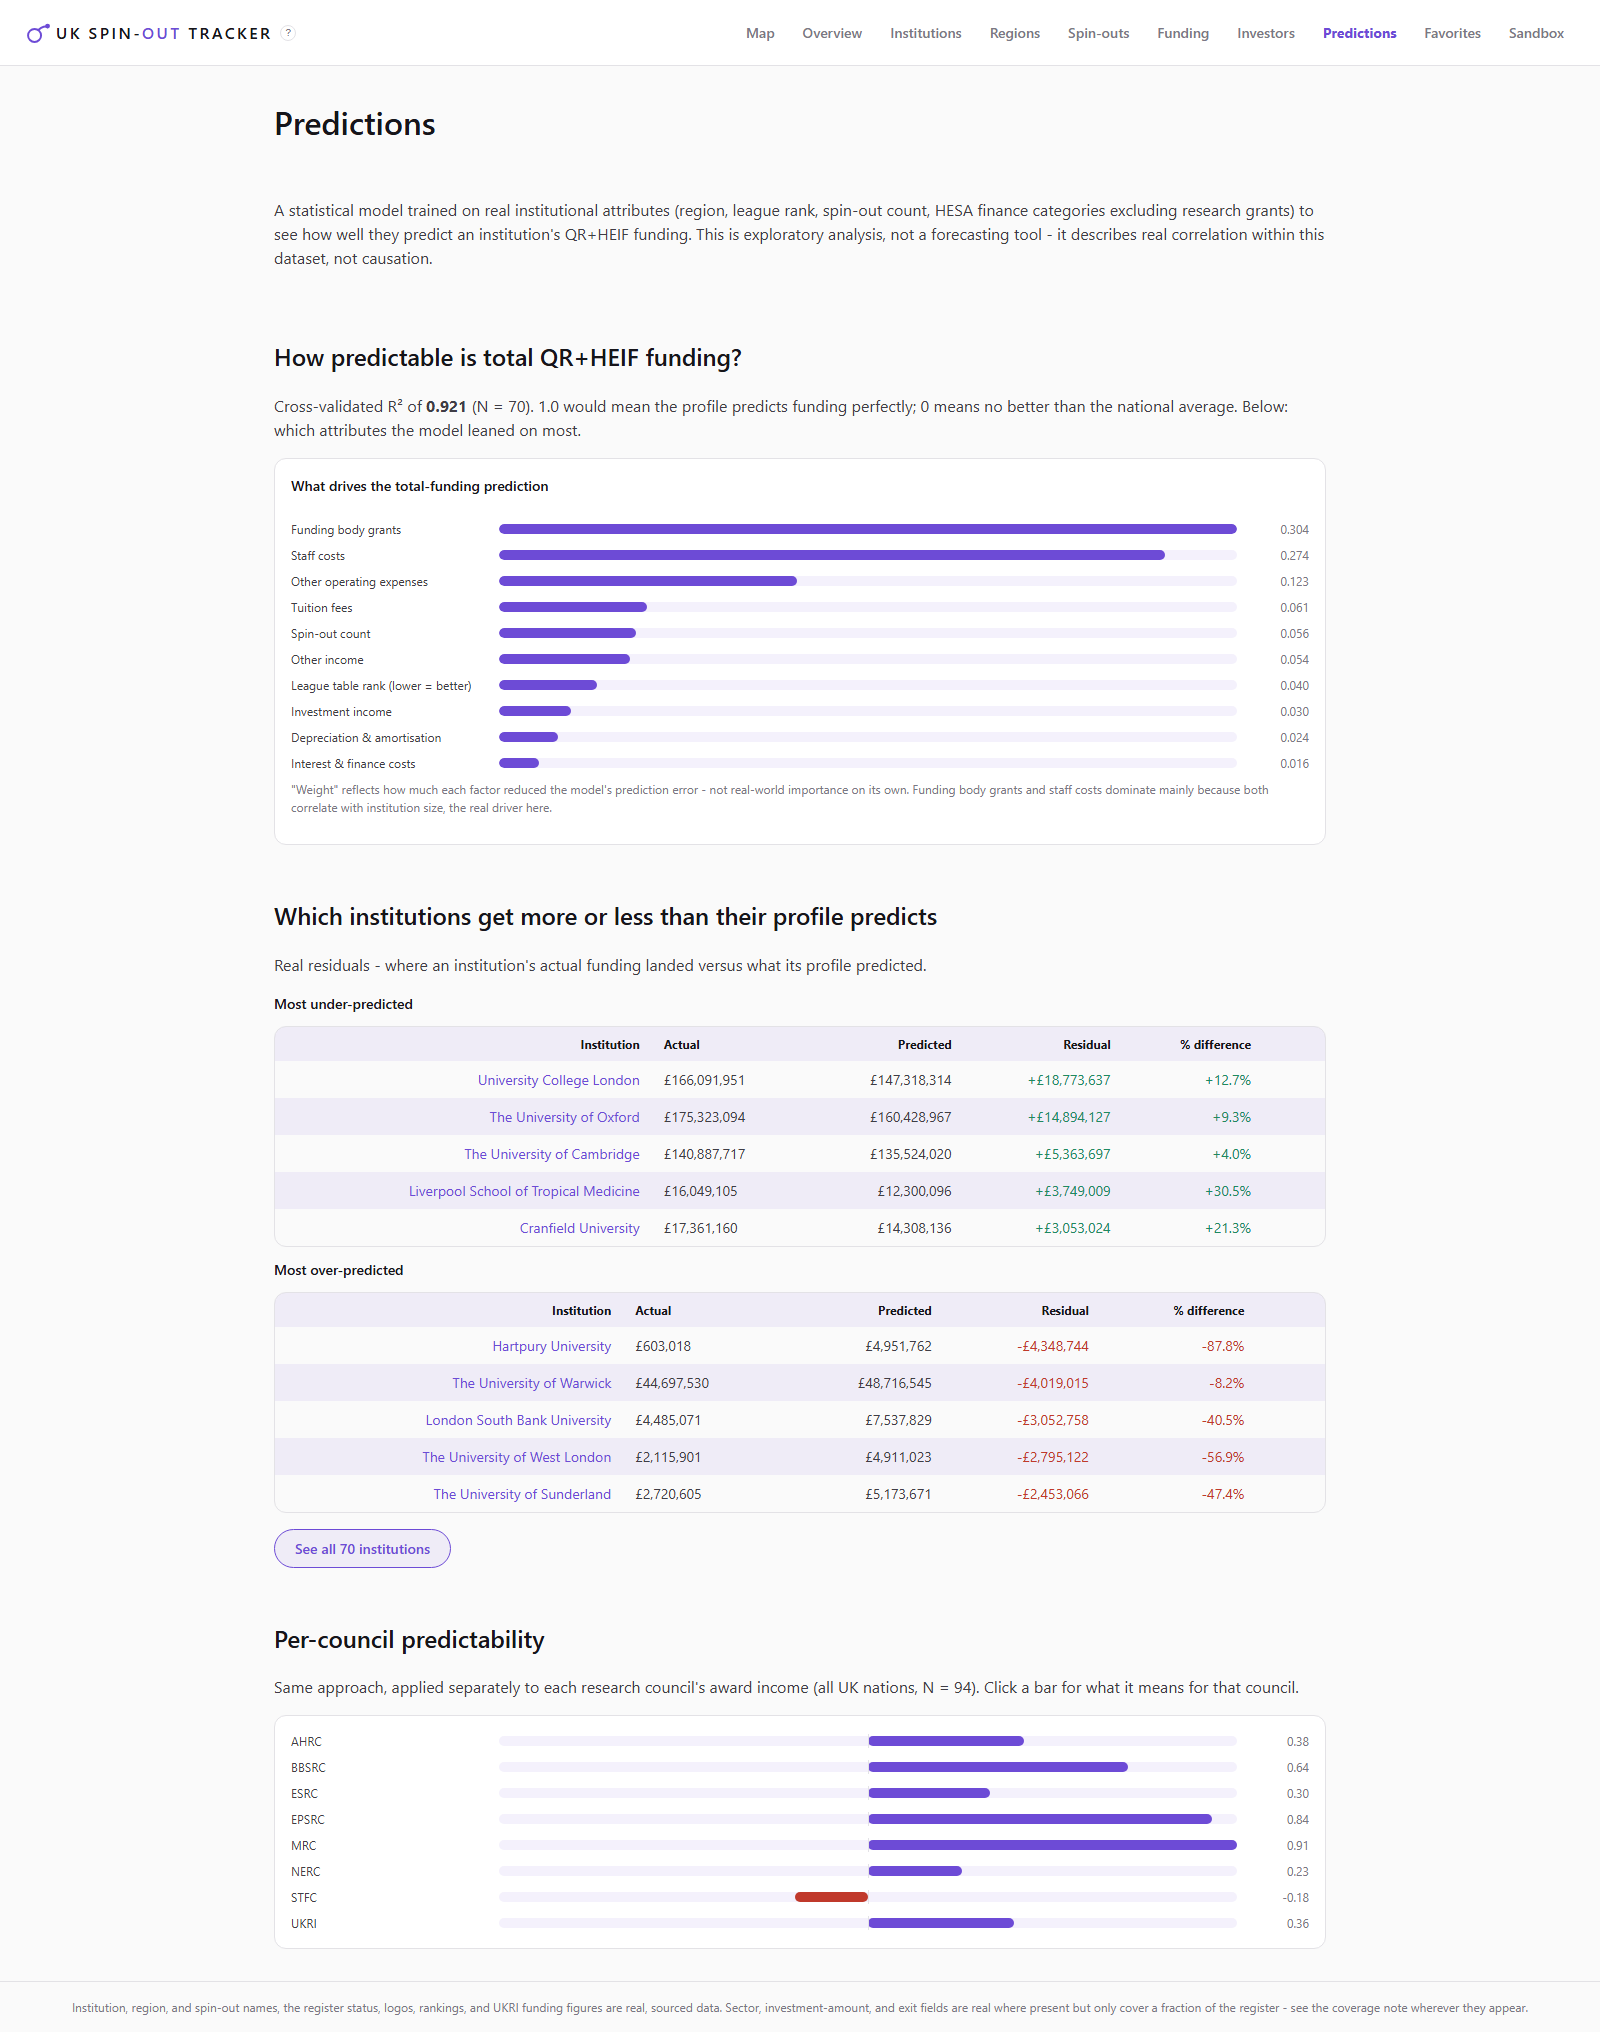
- A funding-prediction model compared against actual research council income across all 70 institutions in scope, surfacing which institutions are notably over- or under-funded relative to their predicted profile.
- Per-council predictability varies substantially: EPSRC and MRC income are well explained by institutional size/profile (R² of 0.84 and 0.91 respectively), while STFC funding is effectively unpredictable from those features alone (R² of −0.18), consistent with STFC funding being concentrated in a small number of specialist institutions the model's features can't see.
- The HESA spin-out register enrichment pipeline (Companies House + web search) adds the "what is this company and how is it funded" context the raw register doesn't provide on its own.
- 2,485 named investors identified purely from corroborated Companies House filings, explicitly framed as a floor rather than a complete picture, since most funding rounds in the register name no investor at all.
- A sandbox workspace for building bespoke comparisons out of any other page's charts and KPI tiles, rather than the dashboard's own page layouts being the only way to view the data.
Discussion